• Follow us on Twitter @buckeyeplanet and @bp_recruiting, like us on Facebook! Enjoy a post or article, recommend it to others! BP is only as strong as its community, and we only promote by word of mouth, so share away!
  • Consider registering! Fewer and higher quality ads, no emails you don't want, access to all the forums, download game torrents, private messages, polls, Sportsbook, etc. Even if you just want to lurk, there are a lot of good reasons to register!

Official Statistical Analysis Thread

NateG;1567632; said:
I'd put that very loosely.

Akron, Syracuse, Temple, Ill, Eastern Ill aren't world beaters and their only challenge Iowa(not even statistically the best per your chart) beat them at their place. I'm not exactly shaking in my cleats. But they will go 10-2 or 9-3 in the regular season due to the soft schedule.

No doubt. The model can only tells us that PSU has been efficient against their competition (#7 in the country in PPP ratio and Victory Gap).

I'd say this method is actually a pretty spotty predictor of future outcomes as no component of schedule strength is incorporated. It can tell you trends, like if a team is good or if they stink it up.

However, we shall see tonight... South Florida is ranked higher than UC in PPP ratio and Victory gap. (3rd and 4th in PPP ratio and Victory Gap, respectively. UC is 4th and 6th.) :paranoid:
 
Upvote 0
Todays NCAA Stats of Interest;

S C O R I N G D E F E N S E

Rank Team G PtPg
1. Florida 9 10.11
2. Nebraska 9 10.33
3. Penn St. 10 10.80
4. Ohio St. 10 11.20
5. TCU 9 11.22
6. Alabama 9 11.78
7. Oklahoma 9 12.33
8. Texas 9 12.44
9. Air Force 10 12.90
10. LSU 9 13.44
11. North Carolina 9 15.33
12. Mississippi 9 15.78
13. Iowa
 
Upvote 0
T O T A L D E F E N S E

Rank Team G Pl Yds Avg TD Ydspg
1. Texas 9 ....589 ..2077 3.53.. 13.. 230.78
2. Florida 9 ....527 ..2092 3.97.. 8.. 232.44
3. TCU 9 ....541 ..2165 4.00.. 12.. 240.56
4. Alabama 9..... 560 ..2180 3.89.. 12.. 242.22
5. North Carolina 9 ....571 ..2245 3.93.. 13 249.44
6. Ohio St. 10 ....644 ..2541 3.95.. 13.. 254.10
7. Air Force 10.... 600 ..2637 4.40.. 15.. 263.70
8. Penn St. 10.... 628 ..2646 4.21.. 11.. 264.60
9. Oklahoma 9... 592 ..2398 4.05.. 13.. 266.44
10. Boise St.
 
Upvote 0
STATS AND BOWL GAMES

or

DON'T RELY ON STATS TO WIN YOU MONEY AT ANYTHING


I applied the Points Per Play ratio (PPP) to every bowl match-up to see if they offer some sort of prediction.

PPP ratio is simply offensive points per play divided by defensive points per play allowed. In short, it's a measure of offensive and defensive efficiency. The higher the number, the more efficient the team. For the regular season, PPP ratio has correlated to winning percentage fairly OK with an R^2 = 0.71.

The Delta column is the absolute difference between the two teams' PPP ratios.

pppbowls1.gif

pppbowls2.gif

pppbowls3.gif


Using the deltas, you can create a confidence ranking; the greater the delta, the more confidence you have in that team winning the bowl game.

pppbowlsconf.gif


Some games of note:


  • The Insight bowl - two 6-6 teams with very 6-6ish PPP ratios battling in Tempe. It will be the greatest game nobody can watch because it's on the NFL Network.
  • The Holiday bowl looks to be a slam dunk in Nebraska's favor. This could very well be the case, however their ratio is boosted by their sick defense led by a certain Heisman finalist, while Arizona's defense hurts them in their PPP ratio. The Huskers offense is efficient, but frankly inept at times and could be their demise (again).
  • The same can be said for the Rose Bowl. The high delta is due to our defense being way more efficient than Oregon's. Hopefully these predictions are right. Which leads me to my picks so far...

Well, they suck. To date, I'm 1 for 3. However, to my credit, the two incorrect picks were relative upsets. (I can dream, damnit.)

You can keep track of my picks (and mock them) using this system on my Bowl Mania entry: ESPN - College Bowl Mania - Poinsettia Bowl Champs
 
Upvote 0
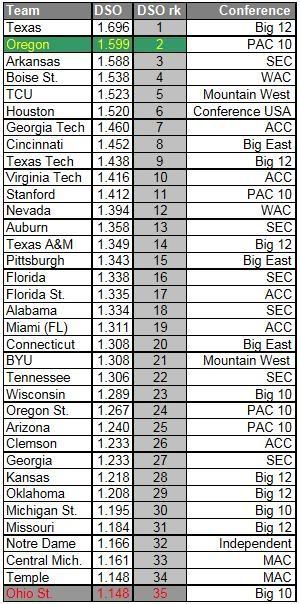
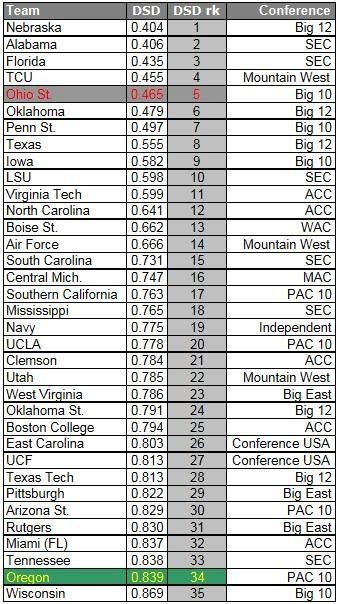
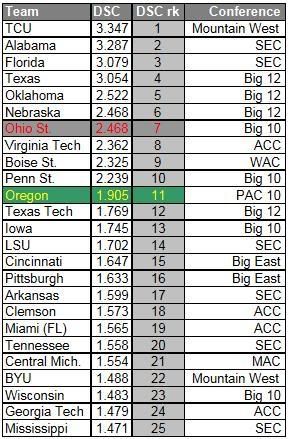
Over the years it has become obvious (as if it weren't already) that DSA is affected heavily by the strength of one's conference. Specifically, the Differential Scoring Composite (DSC) number is profoundly influenced by conference strength. This is why TCU, with the number one DSC number in the country, does not get a sniff for the NC game. Posting a DSC of 3.347 in the MWC is very different from posting a 3.287 in the SEC, which is what Alabama did.

Taking this a step further, the DSC number gives us a way of comparing conferences. Examining the bowl games and noting when a team beats someone with a higher DSC from another conference, one cannot instantly surmise that Team A's conference is better than Team B's, but it is a relevant data point.

So far this year, 15 of 34 bowl games have been played.

Teams with the higher DSC for the regular season have gone 9-6 so far.


Of the 6 times when a team with a lower DSC won, 3 of them were games involving the MAC.
  • Ohio U. had a higher DSC, but lost 21-17 to Marshall of C-USA
  • Temple had a higher DSC, but lost 30-21 to UCLA of the PAC 10
  • Bowling Green had a higher DSC, but lost to Idaho of the WAC
Speaking of the WAC, the only time they weren't on the losing side of this list was when they faced the MAC. The WAC's other bowl games:
  • Fresno had a significantly higher DSC, but lost 35-28 to Wyoming of the MWC
  • Nevada had a significantly higher DSC, but lost 45-10 to SMU of C-USA
This leaves us with just one game where the team with the lower DSC won. It was the only such game that did not involve the WAC or the MAC.
  • The U had a higher DSC, but lost 20-14 to Wisconsin of the Big 10
There you have it. Teams from BCS AQ conferences have faced off 6 times so far this bowl season. Five times, the team with the higher DSC won.

The first "good victory" by this standard goes to the Big 10 (over the ACC). DSC for the rest of the match-ups will be posted shortly so that you can keep track of the conference scoreboard.
 
Upvote 0
DSC for upcoming Bowl participants

Armed Forces Bowl

Houston - 1.258 (C-USA)
Air Force - 1.417 (MWC)

Sun Bowl

Oklahoma - 2.522 (Big 12)
Stanford - 1.347 (PAC 10)

Texas Bowl

Navy - 1.304 (Independent)
Mizzou - 1.233 (Big 12)

Insight Bowl

Minnesota - 0.996 (Big 10)
Iowa State - 0.827 (Big 12)

Chik-Fil-A (fka Peach) Bowl

Virginia Tech - 2.362 (ACC)
Tennessee - 1.558 (SEC)

Outback Bowl

Nwstrn - 0.815 (Big 10)
Auburn - 1.401 (SEC)

Capital One (fka Citrus fka Tangerine) Bowl

PSU - 2.239 (Big 10)
LSU - 1.702 (SEC)

Gator Bowl

WVU - 1.336 (Big East)
FSU - 1.103 (ACC)

The Rose Bowl (aka The Grandaddy of them All)

Ohio St - 2.468 (Big 10)
Oregon - 1.905 (PAC 10)

Sugar Bowl

Cinci - 1.647 (Big East)
Florida - 3.079 (SEC)

International Bowl

USF - 0.900 (Big East)
NIU - 1.109 (MAC)

PapaJohns.com Bowl

Sth Carolina - 1.158 (SEC)
Connecticut - 1.229 (Big East)

Cotton Bowl

Ok. State - 1.320 (Big 12)
Mississippi - 1.471 (SEC)

Liberty Bowl

Arkansas - 1.599 (SEC)
East Caro - 1.245 (C-USA)

Alamo Bowl

Sparty - 1.170 (Big 10)
TTech - 1.769 (Big 12)

Fiesta Bowl

Boise State - 2.325 (WAC)
TX Christian - 3.347 (MWC)

Orange Bowl

Iowa - 1.745 (Big 10)
G Tch - 1.479 (ACC)

GMAC Bowl

CMU - 1.554 (MAC)
Troy - 1.046 (Sun Belt)

BCS NC

Texas - 3.054 (Big 12)
'bama - 3.287 (SEC)
 
Upvote 0
Rushing - Offense & Defense - 2009 Regular Season

The Differential Rushing Numbers for 2009:

2009DRC.jpg


Since DSA compares teams to their opponents' opponents, it is the other defenses in one's conference that DRD measures you against. Similarly, DRO measures rushing offense mostly against other rushing offenses in your own conference.

So it is indeed relevant that Ohio State is measured against some of the best rushing defenses in the country and still comes out looking very good by comparison.

On offense, only OSU appears in the Top 15 for DRO among Big 10 teams, but there are 4 conference teams in the Top 30 (Wisconsin, Illinois, Penn State). Only Oregon and Stanford represent the PAC 10 in the Top 30 in DRO (though it is notable that they are both in the top 11).

This is consistent with Buckeye teams of the Tressel era; smack you in the mouth rushing defense... better than he gets credit for rushing offense. So when it comes to running the ball and stopping the run, Ohio State is the best of a very good bunch (only the SEC matches the Big Ten's 3 representatives in the Top 15 for DRC). By the way... running the ball and stopping the run is what the Rose Bowl is going to be all about.

See you tomorrow afternoon, Donald.
 
Last edited:
Upvote 0
Speaking of rushing defense in the Tressel era:

Ohio State ranks 3rd in DRD for the regular season. That makes 5 top-3 finishes for the Buckeyes since 2001.

USC and Texas have been in the Top 3 three times each. Neither has occupied the #1 spot during that span.

Alabama and TCU have been in the Top 3 twice each.

Only Ohio State has been there FIVE times - three of those times were at the top spot.

No other team has been #1 in DRD more than once since 2001.

BKB's points about defense being part of Ohio State's identity during the Tressel era are borne out by DSA - big time.

Keep quacking Donald.


...less than 20 hours now
 
Upvote 0
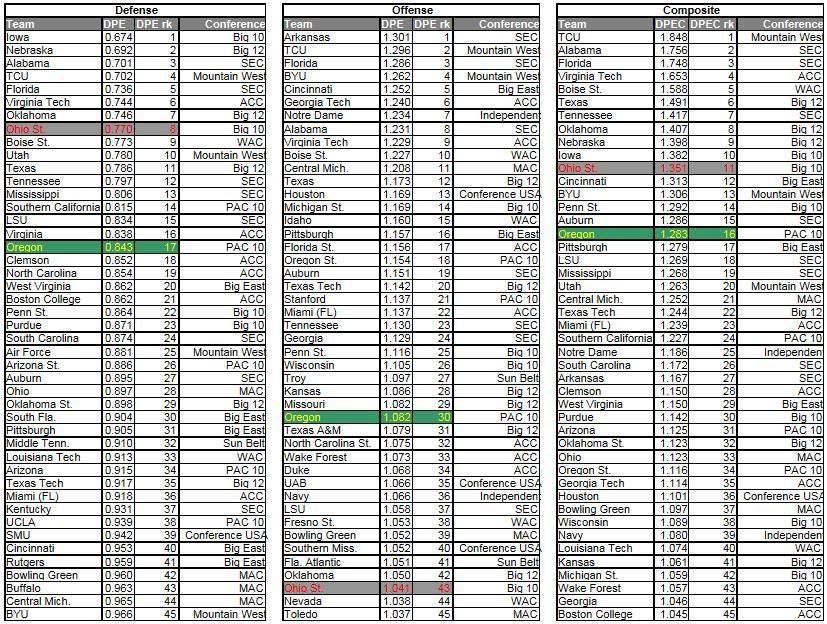
Passing Efficiency

2009DPEC.jpg


For 7 seasons in a row, Ohio State has been in the top 16 in Differential Pass Efficiency Defense.

Part of Passing Efficiency is Yards per Attempt. Ohio State has been in the top 10 in Differential Yards per Attempt (defense) for 7 years in a row. Only 3 other teams (Boise, Iowa, 'Bama) have been in the top 10 for the past 2 years (none of them for longer than that).

So it's not just Rushing Defense. The Buckeyes are consistently great at both rushing and passing defense. No other team is close during the Tressel Era.
 
Upvote 0
Yesterday was another 4-1 day for teams with the higher DSC. The only loss was when the fired up Seminoles sent Bobby Bowden out on a winning note in the Gator Bowl (ACC over Big East)

As for the DSA prediction for the Rose Bowl...
Ohio St: 24-27 points, 312 to 330 yards
Oregon: 17-19 points, 302 to 311 yards
The Buckeyes outperformed the DSA prediction in terms of yards both offensively and defensively; and they scored on the high end of their prediction and held the Ducks to the low end of their score prediction.
 
Upvote 0
For the 3rd day in a row, DSC was 4-1 in predicting the winner of the game. The one loser with a higher DSC than their opponent was Northern Illinois.

So far, the MAC has been involved in 4 bowl games. They've had the higher DSC in every game. They've lost every game. Really a bad showing for the MAC this year...


As for the rest of today's games, it is a vast oversimplification to say that the team with the higher DSC won every game.
  • An SEC team should beat a Big East team who has a DSC that is higher by only 0.071 points. No one but South Carolina's quarterback showed up against UConn; and there were times when he wasn't very good either. DSC called this one; but it really should have gone the other way. This year was Steve Spurrier's worst ever performance.
  • Texas Tech had a significantly higher DSC than the suspension depleted Spartans; but MSU was competitive for 58 minutes. Regardless what happened with Craig James son, it should have been a wood shed game. It won't be played this way in the media; but the Spartans performance was a credit to the Big 10.
  • Arkansas had a higher DSC than ECU of Conference USA, but needed overtime and an insane amount of luck to beat them. This was, in my opinion, a case of what I call "Irritable Bowl Syndrome". Any time a team thinks they're too good for the bowl they're in, they are in serious danger of a crappy performance. Up until the Razorbacks lost a heartbreaker to LSU, they thought they would be in the Cotton Bowl. They ended up in the Liberty Bowl and played like crap and were lucky to pull out the victory. If only the Buckeyes had been so lucky the last time they were disappointed to be playing in the Liberty Bowl.
  • Some might have been surprised that the unranked Rebels were favored by half a TD over the 19th ranked Cowboys. Others might have been surprised that they covered the spread easily; but Mississippi was 25th in Regular Season DSC and Okie State was 35th. It was not at all a surprising result by DSA standards.
By my count, DSC is now 21-9 in predicting bowl winners. Most of the 9 "exceptions" seem to have been cases of a difference in conference strength.
 
Last edited:
Upvote 0
It seems like DSC works pretty well. I would be way cool if DBB or somebody else would do a little revisionist history in the off season. The Big 10 has taken some flack for their recent bowl record, despite sending two teams to the BCS. Two teams in the BCS means that there are tougher match ups across the board. Tougher match ups should told by the DSC. Bottom line, did the Big 10 loose many games they weren't suppose to (per DSC) in recent bowl history?
 
Upvote 0
Back
Top