• Follow us on Twitter @buckeyeplanet and @bp_recruiting, like us on Facebook! Enjoy a post or article, recommend it to others! BP is only as strong as its community, and we only promote by word of mouth, so share away!
  • Consider registering! Fewer and higher quality ads, no emails you don't want, access to all the forums, download game torrents, private messages, polls, Sportsbook, etc. Even if you just want to lurk, there are a lot of good reasons to register!

Official Statistical Analysis Thread

The return of DSA

After a long hiatus, Differential Statistical Analysis[sup]TM[/sup] is returning to Buckeye Planet. Last year, I was too depressed to bother with this level of effort; and the most recent post before this sums up why.

For those who are new to DSA, you might want to review this thread from the beginning. If you're pressed for time, here's a brief synopsis:

DSA compares a teams statistics to the stats posted against their opponents. Differential Scoring Offense (DSO) for example compares how much you score compared to how much everybody else scored against your opponents. If you score twice as many points as your opponents usually give up, your DSO is 2. Sometimes I have expressed this in terms of percentage, but not this year. Differential Scoring Defense (DSD) works the same way, but a lower number is better. If your DSD is 2, you are giving up twice as many points as your opponents usually score.

By far the most popular of the DSA numbers is the Differential Scoring Composite (DSC). DSC is DSO divided by DSD, giving one number that incorporates how good a team is at scoring and how good they are at keeping other teams from scoring. The true power of this comes from the fact that it doesn't just compare a team to their opponents; it compares each team to ALL of the teams that ALL of their opponents have played.

Note: Those of you familiar with DSA will recall that every game against FCS (I-AA) opponents is factored out of every FBS (I-A) team's statistics.

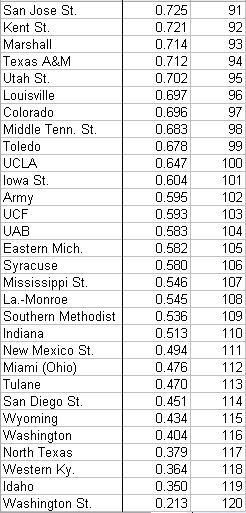
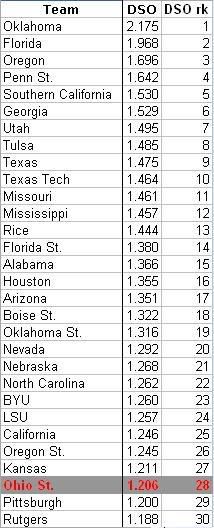
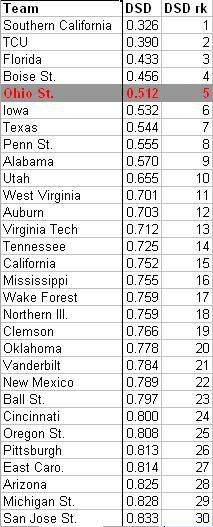
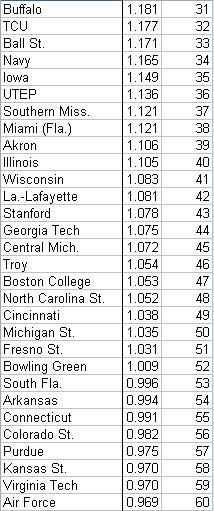
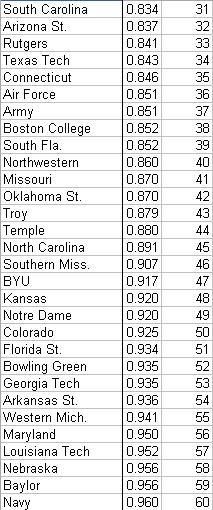
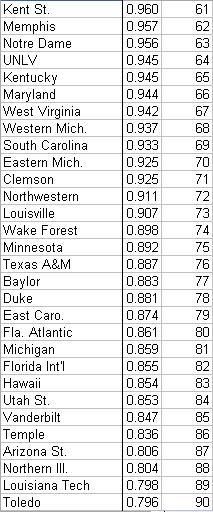
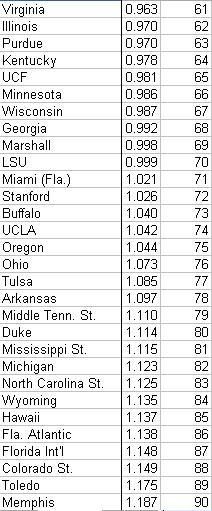
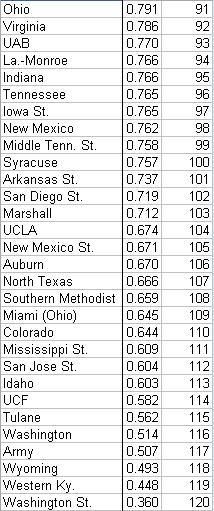
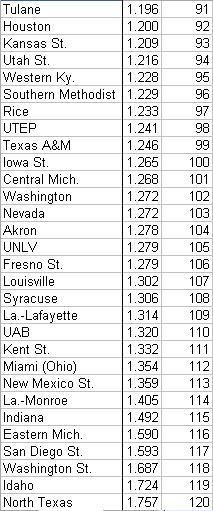
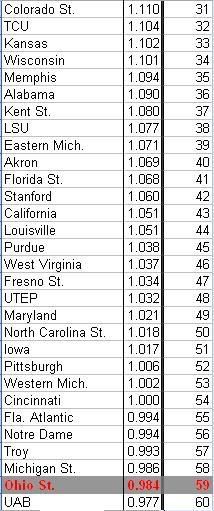
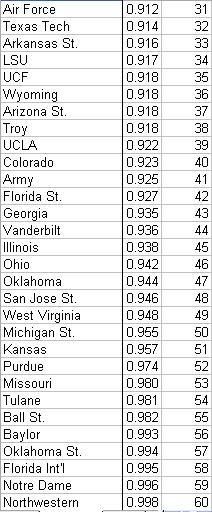
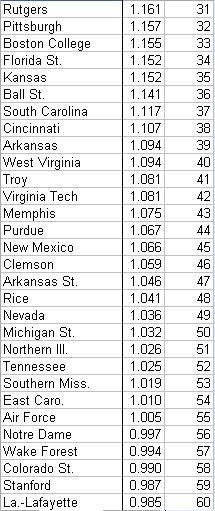
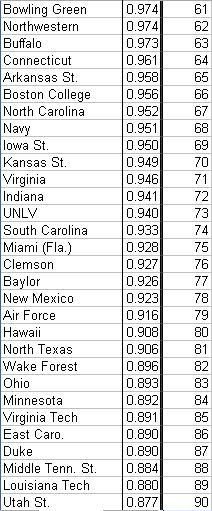
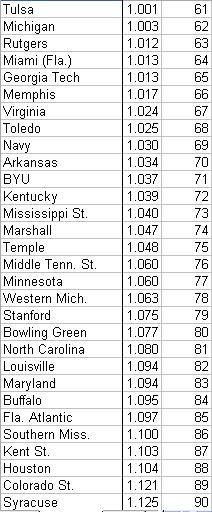
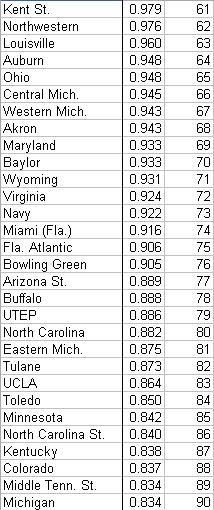
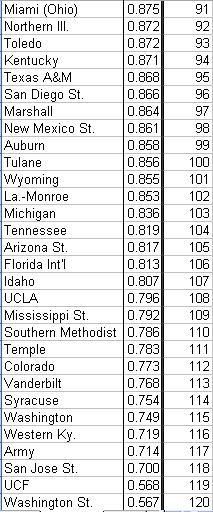
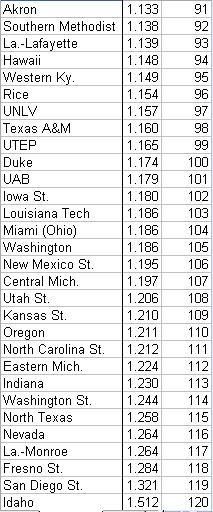
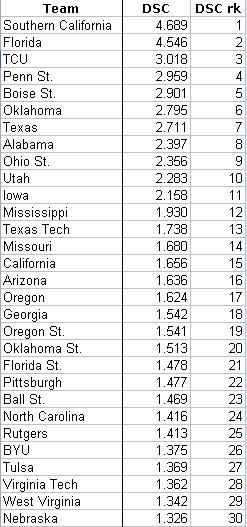
What follows are the DSC numbers for every FBS team last year, including Reclassifying Provisional Western Kentucky (RP is the classification for a team new to the division).
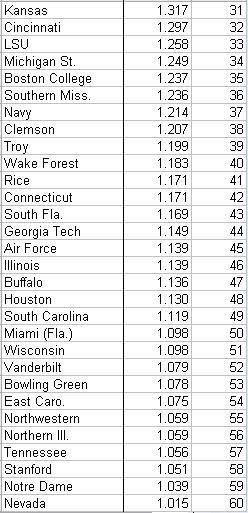
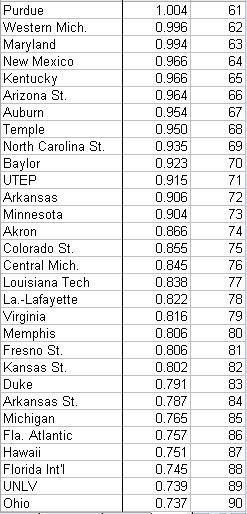
DSC1.jpg

DSC2.jpg

DSC3.jpg

DSC4.jpg


Florida's and USC's DSC numbers are the highest DSC numbers I've seen, and I have them calculated for every team going back to 2004. Ohio State's ninth place showing is their worst in this metric since that year. The Buckeyes led the nation in DSC in 2006 and 2007 and were 4th in 2005.
 
Upvote 0
I call shenanigans.

scUM 85th/Toledo 99th

ND 59th/Syracuse 106th

No way two teams, with two great coaches, both playing at home could lose to such vastly inferior opponents. Somethings got to be wrong with your math.
 
Upvote 0
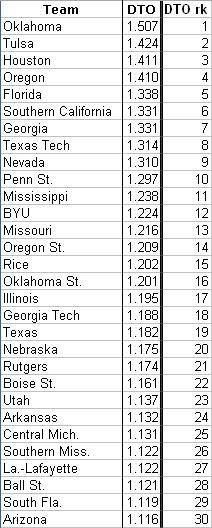
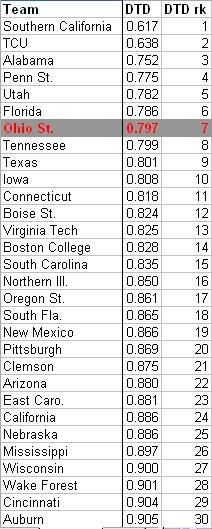
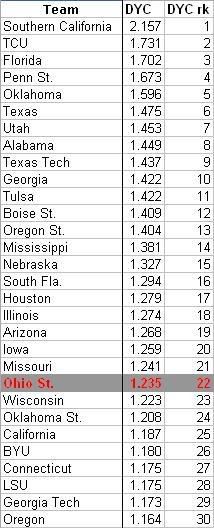
Offense and Defense - Last 5 Seasons

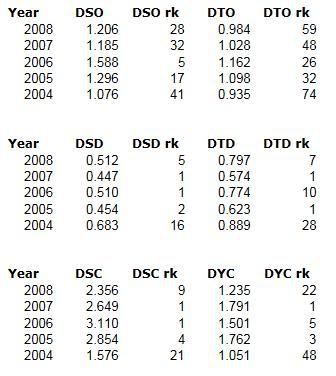
The table below shows Ohio State's:
  • DSO/DTO
  • DSD/DTD
  • DSC/DYC
for every year going back to 2004. I hope to amend this to take it back to the beginning of the Tressel era before the season starts.
(EDIT: See Post #264)

DSCyr-yr.jpg


Observation 1:

It is surprising at first that DSO was actually higher for '08 than for '07; and I will confess to having rechecked my figures when I saw that. But in rechecking the figures, something hit me that may have already been obvious to many of you:

The Buckeyes played a MUCH tougher slate of defenses last year than the year before.

This ratcheted down the denominator(s) in the DSO calculation(s); so if you ratchet down the numerator(s) by the same amount (roughly), you get a slightly higher ratio.

The point of all this is that last year's offense was a small step back from the year before in terms of moving the ball (48th to 59th); but stayed in the same neighborhood in terms of scoring because the Buckeyes went from 76th in the nation in Turnover Margin to 6th in the nation last year.

Observation 2:

Yes, the offense peaked in '06 and the defense peaked in '05 and '07. But those two defenses peaked in different ways, which is why we remember them so differently. This will be illustrated in posts that follow.

Observation 3:

It might seem harsh to say that a defense that was Top 5 in DSD was a major disappointment; but a team that leads the nation in DSD two years running and returns as much of the two deep as this team did has no business going backwards in terms of differential statistics. Go back to the previous page and look at some of the analysis on last year's experience... They had no excuse for deteriorating in DSD and falling off the cliff in DTD.

Perhaps last year's slide had to do with leadership. It was openly speculated upon during the year, and some of the numbers to come bear it out.
 
Last edited:
Upvote 0
Rushing and Passing - Last 5 Years

EDIT: Post #265 has these numbers for the entire Tressel Era, and 2004 has been corrected. Some of the numbers below for 2004 are incorrect.

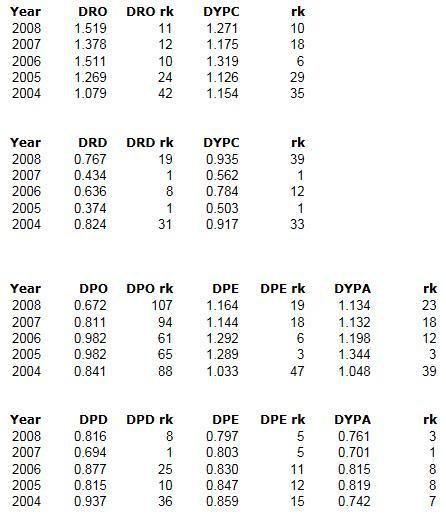
What follows is Ohio State's differential stats for rushing and passing over the last 5 seasons.

  • Differential Rushing Offense (DRO)
  • Differential Rushing Defense (DRD)
  • Differential Yards Per Carry (DYPC)
    • Same acronym used for both offense and defense
  • Differential Passing Offense (DPO)
  • Differential Passing Defense (DPD)
  • Differential Pass Efficiency (DPE)
    • Same acronym used for both offense and defense
  • Differential Yards Per Attempt (DYPA)
    • Same acronym used for both offense and defense
rush-passyr-yr.jpg

Observation 1:

Troy's (mostly) 1.344 DYPA in 2005 was an amazing stat. It seems that defenses took note of Troy's skills in '06 and started defending against his arm, sending DYPA down to 1.198. But this opened up the running lanes and allowed DYPC (offense) to go from 29th in the nation to 6th.


Observation 2:

In spite of the dramatic increase in sacks allowed in '08; DRO, DYPC, DPE and DYPA all increased over the year before. Conclusion: With an average OL, Beanie would have won the Heisman. And considering the passing stats, TP would have been amazing behind an average OL; but he never would have played a meaningful down behind an average OL.


Observation 3:

For at least the past 5 seasons (and almost certainly the past 7 when the numbers for 2002 and 2003 come in) the Buckeyes have been in the Top 10 nationally in Defensive DYPA.


Observation 4:

Pass defense clearly peaked in 2007. Last year's crew nearly matched them in DPE, this was due to the 15 interceptions in '08 vs. just 11 in '07. If not for some dropped INTs, the '07 pass defense might be remembered as one of the best ever around Columbus.


Observation 5:

In case you'd forgotten, it was the 2005 rushing defense that inspired DSA in the first place. They were absolutely amazing and the numbers prove it. Rushing defense definitely peaked in 2005, and it is impressive that the 2007 defense got within a mortar shot of them. This leads directly to...


Observation 6:

Whiskey Tango Foxtrot, over...

How does a defense go from a DYPC of 0.562 (#1 in the nation) to a DYPC of 0.935 (#39 in the nation)? How does a defense that returns so much of the 2-deep, including the entire 2-deep DL, post the worst DYPC number since at least 2004 and almost certainly since 2001?

This is where the struggle for leadership within the team shows itself IMHO. It has been true in teams I've been involved with that whenever struggles develop within the team, the team has less fight/toughness/nastiness on game-day. I'm not sure why that is, but it has been true in my experience and it seems to have been true of last year's Buckeyes.

If that is the case, let's hope Kurt Coleman can be the kind of Captain that I think he will be for this year's defense.
 
Last edited:
Upvote 0
Great stuff DBB.

I disagree with part of observation#2 but I don't have data, its strictly anecdotal.

IMO last year that surge in sacks allowed had more to do with Pryor holding the ball too long than just bad OL play. Don't get me wrong the OL didn't cover themselves in glory but with TP's mobility and a more seasoned approach of just getting rid of it when nothing was there I think the big sack numbers never occur or are, at the very least, greatly reduced.

Numbers wise I've been meaning to ask you what you think of of the yards per point data. Every time I see it I think of your DSC numbers. It seems both are trying to get to the same place (effeciency and realative performance instead of misleading "counting" stats.)

It seems to me at first blush you could take your DSC formula to get a very good idea of what a team is likely to do yardage wise against an upcoming opponent and then use the YPP data to predict the score.

Can we set up a way to back test it?
 
Upvote 0
Jaxbuck;1504718; said:
...Numbers wise I've been meaning to ask you what you think of of the yards per point data. Every time I see it I think of your DSC numbers. It seems both are trying to get to the same place (effeciency and realative performance instead of misleading "counting" stats.)

...

I've been meaning to post some thoughts on the YPP data.

I call that and numbers like it "efficiency" numbers, and the 2002 Ohio State Buckeyes were off the freakin' charts when it came to Yards Per Point, First Downs Per Point, or any other efficiency metric you could think of.

I'm sure no one remembers, but back in the day when we were all still on Bucknuts, I actually calculated and posted efficiency stats for the Buckeyes during the 2002 season (including YPP). I did this under the same screen-name (minus "Daddy").

YPP is incredibly important, and James Patrick Tressel knows it just as well as the guys in 'Vegas. Tresselball is all about squeezing every last point out of every risk that you take on offense.

Tresselball may not be popular, it may not be pretty; but it's going to put another crystal football or two in the case, and YPP is the reason.
 
Upvote 0
DaddyBigBucks;1504934; said:
I've been meaning to post some thoughts on the YPP data.

I call that and numbers like it "efficiency" numbers, and the 2002 Ohio State Buckeyes were off the freakin' charts when it came to Yards Per Point, First Downs Per Point, or any other efficiency metric you could think of.

I'm sure no one remembers, but back in the day when we were all still on Bucknuts, I actually calculated and posted efficiency stats for the Buckeyes during the 2002 season (including YPP). I did this under the same screen-name (minus "Daddy").

YPP is incredibly important, and James Patrick Tressel knows it just as well as the guys in 'Vegas. Tresselball is all about squeezing every last point out of every risk that you take on offense.

Tresselball may not be popular, it may not be pretty; but it's going to put another crystal football or two in the case, and YPP is the reason.

Would some kind of addition of the two metrics yield any kind of meaningful data? Similar to OPS in baseball maybe.
 
Upvote 0
Jaxbuck;1504942; said:
Would some kind of addition of the two metrics yield any kind of meaningful data? Similar to OPS in baseball maybe.

The first thing that comes to mind is differential YPP...

I might find a way to combine them differently though.

Give me a week to chew on this... (good question)
 
Upvote 0
Back
Top