• Follow us on Twitter @buckeyeplanet and @bp_recruiting, like us on Facebook! Enjoy a post or article, recommend it to others! BP is only as strong as its community, and we only promote by word of mouth, so share away!
  • Consider registering! Fewer and higher quality ads, no emails you don't want, access to all the forums, download game torrents, private messages, polls, Sportsbook, etc. Even if you just want to lurk, there are a lot of good reasons to register!

Official Statistical Analysis Thread

jimotis4heisman;1504958; said:
any stats on how often the team who scores more points wins the game?

Jaxbuck;1504972; said:
exhaustive research has discoverd a direct correlation

Indeed, the correlation is exactly 1.000

This trend has lasted slightly longer than the current two-year-trend of sophormore quarterback Heisman Trophy winners.

Trend one is likely to continue this year.

Here's hoping trend #2 lasts for one more year.
 
Upvote 0
Game by Game Differential Scoring - 2008

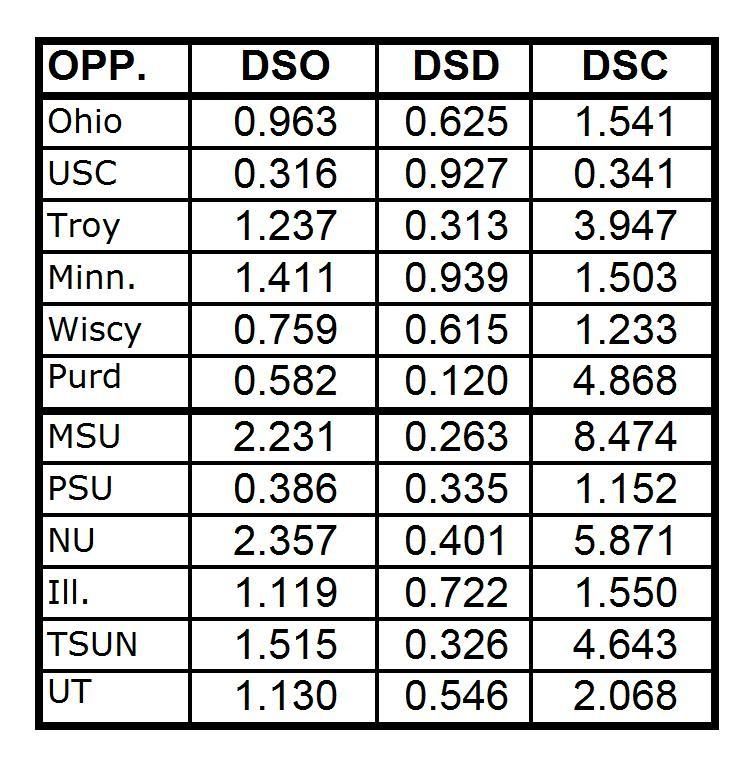
The following table shows the Differential Scoring Offense (DSO), Differential Scoring Defense (DSD), and Differential Scoring Composite (DSC) for each game of the 2008 season. Differential Statistical Analysis[sup]TM[/sup] refuses to acknowledge games against lower division opponents, hence the absence of the game against YSU, no offense intended to the Penguins or their fans.
Game-by-Game.jpg


All stats proving Terrelle Pryor's development will be shown in a large font. This is just the first example of that...

Ohio Game: Arguably the worst performance of the season. As most of Ohio's opponents were MAC schools, DSO for this game suggests that OSU's performance was below average for a MAC school. Yikes. And the defense somnambulating through a performance only 60% better than an average MAC defense was way below their usual output. Having been at the game, I think DSA[sup]TM[/sup] has this about right.

USC Game: The offense's performance was obviously dismal, and the defense continued to sleep-walk.

Troy Game: The offense started to rouse, posting their first DSO above 1.0, thanks in part to TP's four TD passes. But considering the output was only 24% better than your average Sunbelt output against Troy... meh. The defense started to wake up at this point though.

Minne-ha-ha: The offense rolled on the ground in this game, with Terrelle turning in an electrifying 33? yard run for a score. The game was put to bed early, and the Gopher's 15 points in the last 6:31 hurt the defense's DSD for the game. A good performance, but their weakness played in to our strength.

Wisconsin Game: Although the offense struggled for most of the night, Terrelle and company made up for it with the last drive. Overall, a very good outing for the freshman's first game under the lights of a Big Ten stadium. The defense played below expectations again, especially the rushing defense.

Purdue Game: After dazzling in their last drive in Madison, the offense came home and laid an egg. This would turn out to be the theme of the middle part of the season, and is the reason that a line is drawn through the mid-point. The defense clearly started to make a stand here though.

MSU Game: The game when it all came together. The offense rolled as Terrelle bounced back strong from his lackluster performance a week earlier; and no late scores to ruin DSD.

PSU Game: Back to the up-down-up-down theme again. After dazzling the week before, Terrelle shows some inconsistency one more time. Fortunately for the Buckeyes, this trend ended here. The defense performed well enough to get DSC above 1.0; but in this game the Buckeyes overall were only slightly above the average of PSU's schedule, which consisted of 7 other Big Ten teams, 3 patsies and an Oregon State team that left their game on the plane. The Nits clearly did not get our best shot.

Northwestern Game: Up-Down-Up-Down and back UP in a big, big way. Pat Fitzgerald said that Terrelle beat the Wildcats singlehandedly, and this was the highest DSO for the Buckeyes all year. A DSD of 0.40 was the highest in 4 weeks, but reflected only a Wildcat touchdown and was still quite respectable.

Illinois Game: No More up and down. Terrelle played well at Illinois. The game was too windy to rely too heavily on the freshman's arm, but he supplemented Chris Wells' rushing with 110 yards of his own; and against a talented defense that knew it was coming. The Ohio State defense was opportunistic in this game, but again had trouble against the run. This is the one troubling spot in this analysis, as the defense had otherwise shown very good improvement to this point.

The Game: 42-7

Fiesta Bowl: Not a bad performance by the freshman, and a respectable outing by the defense. When you consider the number of outstanding offenses in the Big 12, it is notable that Ohio State scored 13% more than those offenses averaged against Texas.


OVERALL: When you split the season in half and compare the two, the numbers bear out what we saw last year; the Buckeyes improved dramatically on both sides of the ball as the year went on. While some will suggest that "everyone gets better as the year goes on" that doesn't explain away the numbers. When DSA[sup]TM[/sup] numbers go up, you're improving more than your opponents are.

This is especially true when you consider one key fact: for the first quarter of the season, DSA compared the Buckeyes to the MAC, the Sun Belt and the Pac-10 MINUS USC; none of which was all that impressive last year (unless you ask the Mountain West Conference).

So even though the first half of the season compared OSU against a lower standard than the second half of the season, the Buckeyes still turned in a much better performance over the second half.

First Half DSO (average):__0.878
Second Half DSO (average):_1.456
First Half DSD (average):__0.590
Second Half DSD (average):_0.432
First Half DSC (average):__2.239
Second Half DSC (average):_3.960
 
Upvote 0
DaddyBigBucks;1504934; said:
I've been meaning to post some thoughts on the YPP data.

I call that and numbers like it "efficiency" numbers, and the 2002 Ohio State Buckeyes were off the freakin' charts when it came to Yards Per Point, First Downs Per Point, or any other efficiency metric you could think of.

I'm sure no one remembers, but back in the day when we were all still on Bucknuts, I actually calculated and posted efficiency stats for the Buckeyes during the 2002 season (including YPP). I did this under the same screen-name (minus "Daddy").

YPP is incredibly important, and James Patrick Tressel knows it just as well as the guys in 'Vegas. Tresselball is all about squeezing every last point out of every risk that you take on offense.

Tresselball may not be popular, it may not be pretty; but it's going to put another crystal football or two in the case, and YPP is the reason.

i've played a bit with YPP. the '02 D forced teams to go more than 28 yards per point.
 
Upvote 0
I'm doing a lot of stats analysis in my line of work. (This means less BP :(.) I had some time to kill last week and pulled together the data from 2008.

I looked at offensive points per play (OPPP) and defensive points allowed per play (DPPP). For OPPP, higher is better. For DPPP, lower is better.

Then I took OPPP and divided it by DPPP to make a ratio.

I figured this would paint a picture of offensive efficiency and weight it against having an effective defense. ("Big plays win big games" and "Defense wins championships" come to mind.)

For 2008, the correlation to winning percentage is a solid "meh" at 0.66. However, the top ten is sorta close to the top ten in DBB's work a few pages back.

Here are 119 teams sorted by OPPP/DPPP (forgot about Western Kentucky... Hilltoppers, sue me. Line forms to the left.).


mfG3h.gif

3c3uf.gif

iVbGN.gif
 
Upvote 0
More numbers and stuff...

Since there was talk of Yards Per Point (YPP), I ran the numbers for 2008, for offense and defense.

For Off. YPP, lower is better: that is to say it takes you less yardage to score (more efficient offense).
For Def. YPP, higher is better: that is to say you're forcing your opponents to get more yards for each point.

For fun, I took Def. YPP minus Off. YPP and (for a lack of a better word) called it "Victory Gap." For convenience, this helps to rank a team based on their combined effectiveness.

161XP.png

boLtp.png


BTW, the RSquare for this when correlating to winning percentage is OK at 0.66.
 
Upvote 0
Post #248 Redux

EDIT (error correction): The table below shows Ohio State's 2001 rank in DSC as 36th. The actual rank was 37th.


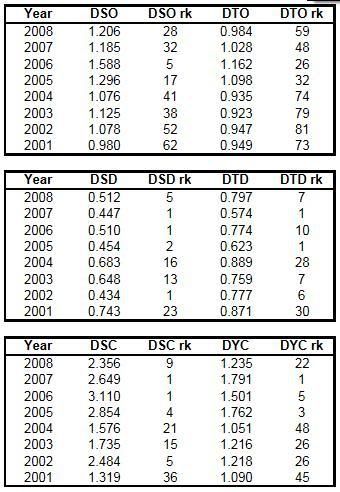
As promised (sort of), here are the Differential Statistical Analysis[sup]TM[/sup] numbers for the entire Tressel Era.

Here is the brief synopsis of DSA from post #241 for those of you who aren't familiar with the term:
DSA compares a team's statistics to the stats posted against their opponents. Differential Scoring Offense (DSO) for example compares how much you score compared to how much everybody else scored against your opponents. If you score twice as many points as your opponents usually give up, your DSO is 2. Sometimes I have expressed this in terms of percentage, but not this year. Differential Scoring Defense (DSD) works the same way, but a lower number is better. If your DSD is 2, you are giving up twice as many points as your opponents usually score.

By far the most popular of the DSA numbers is the Differential Scoring Composite (DSC). DSC is DSO divided by DSD, giving one number that incorporates how good a team is at scoring and how good they are at keeping other teams from scoring. The true power of this comes from the fact that it doesn't just compare a team to their opponents; it compares each team to ALL of the teams that ALL of their opponents have played.

Other stats below:

DTO = Differential Total Offense
DTD = Differential Total Defense
DYC = Differential Yardage Composite

DYC does for yards what DSC does for points.

DSCyr-yr-1.jpg


There are many conclusions that one can draw from the numbers, but three jump out at me.
  1. The Buckeyes were only #5 in DSC in 2002. All other stats for 2002 were good to just average or worse.
  2. Every time the Buckeyes have led the nation in Differential Scoring Defense under Jim Tressel, they have played for the NC.
  3. 2003 was not nearly as good a year as I thought it was.
More on point #3 in the next post...
 
Last edited:
Upvote 0
Post #249 Redux

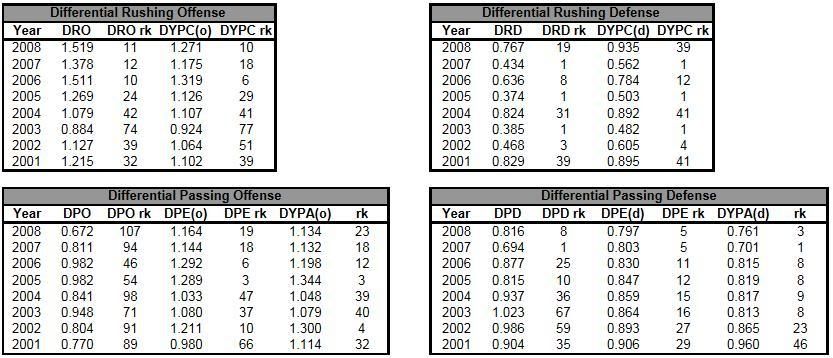
Here are the rushing and passing numbers for the Tressel Era.

In auditing the spreadsheets to ensure that they are "Preview worthy", it was discovered that a change that the NCAA made in the way they record statistics between '04 and '05 caused an anomaly in the 2004 spreadsheet. The mistake has been corrected, so some of the numbers for 2004 are different than what is in Post #249.

rush-passyr-yr-1.jpg


DRO = Differential Rushing Offense
DYPC(o) = Differential Yards Per Carry (Offense)
DRD = Differential Rushing Defense
DYPC(d) = Differential Yards Per Carry (Defense)

DPO = Differential Passing Offense
DPE(o) = Differential Passing Efficiency (Offense)
DYPA(o) = Differential Yards Per Attempt (Offense)
DPD = Differential Passing Defense
DPE(d) = Differential Passing Efficiency (Defense)
DYPA(d) = Differential Yards Per Attempt (Defense)
A few observations:
  1. Picking up where the last post left off: Holy Cow was the rushing offense bad in 2003. It really makes one wonder what might have been had MoC handled the spotlight (and life) better.
  2. I always thought that Rushing Defense was the Buckeyes' trademark during the Tressel Era; but look at the passing defense.
    • The Buckeyes haven't been lower than 16th in defensive DPE since 2002.
    • And they haven't been lower than 9th in defensive DYPA since 2002.
    • That's 6 consecutive years in the top 10 in DYPA. Auburn and USC have been in the top 10 the last 2 years (but not 3).
  3. 2009 is an odd numbered year, so it's time for the Buckeyes to lead the country in DRD and defensive DYPC again.
 
Last edited:
Upvote 0
It is fitting that my 5000th post here should be about numbers.

For all of the griping that has gone on for the past month from much of the board (myself included), you'd never know that the Buckeyes are putting up some very respectable differential numbers this year. And when you consider the under-performance against Navy and the fact that Barkley and Mays still don't appear to be quite the same after having played us; the differential numbers may actually improve.

DSC so far this year is 3.244. That is better than any OSU team has had for a full season since JT's arrival.

DYC so far this year is 1.860. That too is better than any OSU team of the previous 8 seasons.

And would you believe that after our start to the year that Differential Rushing Offense (DRO) is already higher than it has been for a full year during the Tressel era (1.616).

If the Buckeye offense continues to develop and evolve, this team has the potential to be truly special, even by our lofty standards. What they have going is better than anyone is giving them credit for right now. They are standing on the verge of a year that will surprise everyone but us.
 
Upvote 0
Of the Top 6 teams in the Big 10 in Total Defense, only Ohio State's FBS opponents are averaging over 400 yards per game as a group.

The Buckeyes trail leader Penn State by exactly 100 yards in Total Defense (25 yards per game); and the two are well in front of 3rd place Iowa (by more than 45 yards per game).


In Yards Per Play given up, the gap is even narrower:
  • PSU Defense: 3.996 YPP
  • OSU Defense: 4.140 YPP
But as the first sentence hinted, the biggest difference between the two defenses is in the offenses they've played. PSU's opponents average 320.395 YPG. OSU's opponents average 400.355 YPG. The highest ranked (total) offense played by the Nits is Iowa, who come in at 81st in the nation. The lowest ranked (total) offense played by the Buckeyes is Illinois, who come in at 82nd in the nation. And it is worth noting that Iowa is ahead by a fraction of a yard only because they've played one more game than Illinois. Both teams are exactly one yard away from averaging 348 yards per game. And it is probably worth noting that Iowa gained 298 on the Nits while the Buckeyes held Illinois to 170.

By the end of the conference slate, the Buckeyes will lead the conference in Total Defense by at least 30 yards per game; and Penn State won't be in 2nd place.
 
Upvote 0
Week 4 Stats

OR

My model kinda sucks without more data

jaFjX.gif

OPPP/DPPP = Off. Points per play divided by Def. points per play allowed

Off. YPP = Offensive Yards Per
Point (lower is better)
Def. YPP = Defensive Yards Per
Point allowed (higher is better)
Victory Gap = Def. YPP minus Off. YPP (higher is better, negative numbers mean you suuuuck)
So... from this we can see that Illinois is bad. They are, in 4 weeks' worth of competition, about as efficient as NMSU. Michigan has the most efficient offense on our schedule while PSU and Iowa appear to be our biggest tests so far this season. Also, surprisingly, Wisconsin's offense seems to be pretty potent.

(I wish I could get away with this level of ambiguity at work. "So the data shows that people will like this product... or not! Where's my paycheck?")
 
Last edited:
Upvote 0
A comparison: Wisconsin, before and after Ohio State

OR

YEAH WE BAD

Lets take a look at our the stats prior to playing Wisconsin:

mCUv6.gif


Prior to playing us, Wisconsin came into the game with an undefeated record and respectable efficiency ratings - particularly their yards-per-point metrics. Then, the game...

FDtSo.gif


Wisconsins PPP ratio dropped by 0.3 points, while their Victory Gap fell more than 2 points, into the negative.

Speaking of negative, Purdue is fighting for the title of "Least Efficient Defense Left On Our Schedule." While Illinois :slappy: is currently in the lead for the overall "Worse than NMSU" award. Get it together, son.

By the numbers, PSU remains to be our biggest threat, but that's mostly due to Iowa taking a beating from their close win over scUM.
 
Upvote 0
rocketman;1567474; said:
By the numbers, PSU remains to be our biggest threat

I'd put that very loosely.

Akron, Syracuse, Temple, Ill, Eastern Ill aren't world beaters and their only challenge Iowa(not even statistically the best per your chart) beat them at their place. I'm not exactly shaking in my cleats. But they will go 10-2 or 9-3 in the regular season due to the soft schedule.
 
Upvote 0
Back
Top