• Follow us on Twitter @buckeyeplanet and @bp_recruiting, like us on Facebook! Enjoy a post or article, recommend it to others! BP is only as strong as its community, and we only promote by word of mouth, so share away!
  • Consider registering! Fewer and higher quality ads, no emails you don't want, access to all the forums, download game torrents, private messages, polls, Sportsbook, etc. Even if you just want to lurk, there are a lot of good reasons to register!

Official Statistical Analysis Thread

smithlabs;1634257; said:
It seems like DSC works pretty well. I would be way cool if DBB or somebody else would do a little revisionist history in the off season. The Big 10 has taken some flack for their recent bowl record, despite sending two teams to the BCS. Two teams in the BCS means that there are tougher match ups across the board. Tougher match ups should told by the DSC. Bottom line, did the Big 10 loose many games they weren't suppose to (per DSC) in recent bowl history?

I will do exactly that, though I won't call it "revisionist" history. It will simply shed some light (I suspect) on the fact that match-ups have a great deal to do with conference record in the post season.

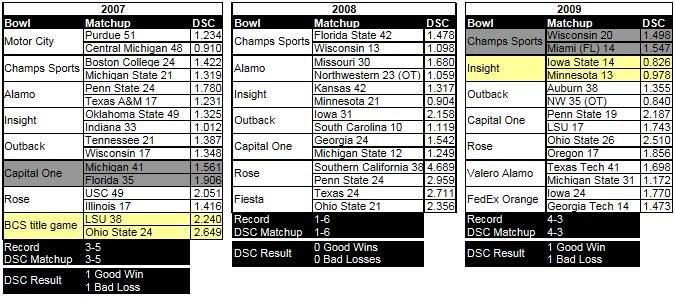
As for the post season that just ended - DSC went 3-1 as a predictor in the final 4 games of the season; missing only on the Fiesta Bowl. In my opinion, that game was a case of the TCU quarterback utterly melting under the heat of the limelight. Dalton was absolutely horrible in that game from where I sat.

DSC Summary:

Final Record: 24-10
  • 4 losses by the MAC when they had the higher DSC ranking. Their lone win was against the Sun Belt when their DSC was more than half a point higher - and they needed double OT.
    • The MAC stinks
  • 2 losses by the WAC when they had the higher DSC ranking.
    • The WAC stinks
  • 1 win by the WAC when they had the lower DSC ranking. This was the no-show by Dalton of TCU.
    • Gotta have a QB that can handle the Big Stage
    • Thanks TP
  • 1 Win For the Geezer - FSU over WVU
    • BB's last game
    • Based on talent: FSU should have been that good all season
  • 1 win by the Big 10 - Wiscy over The U
    • Big 10 better than ACC
  • 1 loss by the Big 10 - Minne against Iowa State; but the Cyclones faced a Gopher team devoid of Eric Decker.
    • 1 point loss without only offensive weapon
 
Upvote 0
2009DSCFinal.jpg


It's interesting (or at least a little amusing) that TCU's DSC went UP in spite of losing their bowl game. That's because including the Fiesta Bowl in DSA compared them to Boise's other opponents; who were mostly a bunch of WAC jobs. I still maintain that if TCU's Quarterback (Dalton) had played only adequately, they would have handled Boise with ease.
 
Last edited:
Upvote 0
smithlabs;1634257; said:
It seems like DSC works pretty well. I would be way cool if DBB or somebody else would do a little revisionist history in the off season. The Big 10 has taken some flack for their recent bowl record, despite sending two teams to the BCS. Two teams in the BCS means that there are tougher match ups across the board. Tougher match ups should told by the DSC. Bottom line, did the Big 10 lose many games they weren't suppose to (per DSC) in recent bowl history?

Good question...

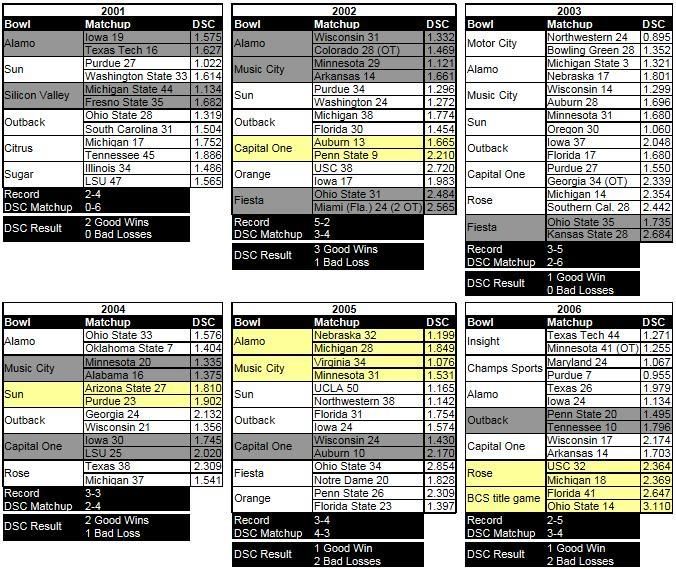
In the tables below (labeled by season, not calendar year), "DSC Matchup" indicates the record that the Big-10 would have had if the team with the higher DSC number won every game. A "Good Win" then, is a Big 10 win over an opponent with a higher DSC, and a "Bad Loss" is to an opponent with a lower DSC.

"Good Wins" are highlighted in Grey
"Bad Losses" are highlighted in Maize

B0WLS01-06.jpg

B0WLS07-09.jpg


Overall, the conference has 12 Good Wins and 8 Bad Losses; with 43 games that went according to Hoyle. Not too shabby... overall.


But look at how the record was compiled.
  • 2001-2004: More Good Wins than Bad Losses every year
    • 8 Good Wins (3 vs. SEC)
    • 2 Bad Losses (1 vs. SEC)
    • Buckeyes get two good wins
  • 2005-2006: :sick1:
    • 2 Good Wins (Both vs. SEC)
    • 4 Bad Losses (1 vs. SEC)
    • No Show in Glendale
  • 2007-2009: meh
    • 2 Good Wins (1 vs. SEC)
    • 2 Bad Losses (1 vs. SEC)
    • '07 NC game (Played Jan08) was a bad loss with an asterisk
      • LSU had crazy differential numbers when Glenn Dorsey was healthy, which he was for the NC game.
Good Wins and Bad Losses are usually more about the under-performance of the favorite than anything else. Where DSC is different by only a tenth of a point or so a favorite can be excused for being within the margin of error of the data.

Many of the other under-performances (DSC-wise) have fairly easy explanations.

Reason #1: Conference Disparity:
  • MSU over Fresno in '01
  • Wiscy over Miami in '09 (Small DSC difference, but the game was physically dominated by the Badgers)
Reason #2: Irritable Bowl Syndrome (IBS). IBS occurs when a team thinks they are too good for the bowl they're in:
  • Arkansas and Penn State in '02 - The 'Nits really thought they belonged in a BCS Bowl
  • Kansas State in '03 (there may also have been a bit of conference disparity at work here)
  • Iowa's miracle over LSU in '04?
  • TSUN, Minnesota and Auburn in '05
    • The Wolverines had the highest DSC of any team to play in the Alamo Bowl in the last 9 years, with one exception. Texas had a huge DSC advantage over Iowa in '06 and squeaked out a 2 point win.
    • Minnesota '05 and Arkansas '02 were the only teams to play in the Motor City Bowl with a DSC over 1.5. Both lost due to IBS.
    • Auburn had gone undefeated to no avail in '04 and was snubbed by the BCS in '05. They pulled a no-show in the Cap One and were physically dominated by a team with a much lower DSC.
Reason #3: Garden Variety over-confidence
  • 2002 NC game (Jan03): Miami's DSC wasn't that much higher than Ohio State's. They only thought they were much better.
  • Glendale - over-confidence was only part of the story. We need not delve into the rest. Suffice to say there were plenty of reasons why this is one of the bigger no-shows of the past 9 years that didn't involve IBS.
Reason #4: Not an under-performance at all. Sometimes an underdog wins because they finally are playing up to their potential.
  • TSUN - 2007 season: In Lloyd Carr's final game, they finally played like they were capable of playing to send him out the right way.
  • LSU - 2007 season: When Glenn Dorsey was healthy, the Tigers really were All That
Conclusion:

Sometimes it is reasonable to claim that a team didn't show up; sometimes it isn't. DSC can usually tell which is which.
 
Upvote 0
Post #1 Redux

What follows is an update to post #1 of this thread. As there have been so many new members since the inception of this thread, the explanation of the data is reiterated here.

.
.
.


While all-time winning percentage is one way to gauge the relative success of different programs, we can extend our look at historical winning percentage to give us a more complete story for each team.

The method here is to take all the top teams in the sport and then measure their relative winning percentage for every range of years that starts with any year the sport was played and ends with 2009. In other words, let's examine everyone's rank vis a vis winning percentage over ALL of the following date ranges:

1869 to 2009
1870 to 2009
1871 to 2009
1872 to 2009
1873 to 2009
.
.
.
2007 to 2009
2008 to 2009
2009


This gives us data for 141 ranges. It's a large volume of data, and there are several ways to look at it. The power of this method of looking at historical winning percentage is that it provides a metric for how well a team has maintained a high level throughout every era of football.

Let's lay some ground rules before we dig into the numbers: The top 14 teams in all-time winning percentage (the first range considered) are the only teams considered in the analysis. #15 was Miami U. (Ohio) and Boise State has only been playing I-A football since 1996. They're not in the discussion: we're moving on.


1) Average Ranking over ALL Ranges
  1. Ohio State_____2.63
  2. Oklahoma_______5.09
  3. Texas__________5.28
  4. Michigan_______7.63
  5. USC____________7.82
  6. Nebraska ______8.08
  7. Penn State_____8.16
  8. Tennessee_____10.62
  9. Alabama_______10.96
  10. Georgia_______11.79
  11. Notre Dame____12.38
  12. Florida State_13.04
  13. Miami_________13.48
  14. LSU___________15.13
The first thing to note is that Ohio State's average ranking actually improved by nearly half a point over the analysis of three years ago. This is striking because Ohio State was 9th for the penultimate range in the series (2008-2009) and was ranked 8th for the last range in the series (2009 by itself). As these mark 2 of the 3 seasons that did not factor into the original analysis, and since the rankings are the lowest for any range for the Buckeyes, it is remarkable that the average rank improved markedly in spite of this. The reason for this is that this analysis rewards one thing above all else: consistency. The Buckeyes are consistently good more than any other team, and no one else is close.

But there was a team that was close 3 years ago. But that was before the train wreck in Ann Arbor. TSUN trailed tOSU closely a short time ago because they used to be remarkably consistent themselves. Disasters like the last 2 years just never happened to the skunk bears... or at least not before RichRod. Much like the public perception of TSUN, this analysis will punish Michigan for 2008 and 2009 for years to come.


2) Median Ranking over ALL Ranges
  1. Ohio State_______2
  2. Michigan_________5
  3. Oklahoma_________5
  4. Texas____________5
  5. Alabama__________6
  6. USC______________7
  7. Notre Dame_______8
  8. Nebraska_________8
  9. Tennessee________9
  10. Penn State_______9
  11. FSU_____________11
  12. Georgia_________12
  13. LSU_____________13
  14. Miami___________14
The medians changed far less than the averages. For TSUN to have dropped 2 points off of their median in just 3 seasons is amazing to put it mildly.


Now for the number that is my personal favorite: What is the LOWEST rank in winning percentage for any of the ranges for each team? For example, for several ranges beginning in the 1980s, Ohio State was 5th in winning percentage. That was the lowest ranking that Ohio State has for any range considered (except the last 2). In order to be fair to the teams that have fallen on hard times recently, I have ignored all rankings for any range starting after 1999 for the purposes of this discussion. (Alabama was helped most by this expedient, 3 years ago. This time, Notre Dame was helped most.)


3) Lowest Ranking for Any Range
  1. Ohio State_______5
  2. Texas___________12
  3. Oklahoma________14
  4. USC_____________14
  5. Nebraska________16
  6. Georgia_________16
  7. Miami-Florida___17
  8. Michigan________18
  9. Tennessee_______19
  10. Florida State___22
  11. Penn State______25
  12. LSU_____________25
  13. Notre Dame______42
  14. Alabama_________43
Last time I did this, the take away was how far ahead of everyone else the Big 2 of the Big 10 were. This time, the Buckeyes stand very much alone.


A few other observations:
  • Ohio State is the only team to be #1 in winning percentage for ranges beginning in 6 different decades. (It was 5 decades the first time I did this) (All 4 of Michigan's decades were in the 19th century) (OSU's 6 decades were the 1900's, the '10s, the '20s, the '30s, the '50s and the '90s). The new addition to the Big 10, Nebraska, appears at #1 in ranges beginning in 4 different decades. No one else is at the top in more than 2 decades.
  • If you measure the amount of time from a team's first appearance at #1 to their last appearance at #1 (based on starting year of the date range), then OSU is way out in front. [strike]OSU's first appearance at #1 was in the range 1923-2006, and their last was in the range 1996-2006[/strike]. The Buckeyes' first appearance at #1 has been pushed back to the range beginning in 1909, 101 years ago. Their last range at #1 is 1996-2009. That's a span of (inclusive) [strike]74[/strike] 88 years. Michigan's span is [strike]54[/strike] 30 years. Nebraska's span is [strike]24[/strike] 25 years. Oklahoma's span is [strike]14[/strike] 15 years. Notre Dame had a 10 year span, Miami 5, Texas 2 and Alabama had the best record in 2009 (1 span if you can call it that). No one else was #1 for any range at all.
  • Ohio State was ranked either #1 or #2 for ranges beginning from [strike]1923 to 1963[/strike] 1902 to 1975. No one else is even close to an accomplishment like that.
  • Ohio State does not appear below #4 in any range starting before [strike]1976[/strike] 1980 and does not appear below #5 for any range starting before 2008. Michigan does not appear below #4 in any range starting before [strike]1949[/strike] 1913. Notre Dame first appears below #4 in the range beginning with [strike]1927[/strike] 1922. For Texas it was 1902. Every other team's first appearance below #4 was in the 19th century.
Any way you slice it, The Ohio State Buckeyes are the most consistently good to great team in the history of college football.
 
Last edited:
Upvote 0
One more observation: Of the 141 ranges considered, the Buckeyes were #1 or #2 82 times. Notre Dame has been #1 or #2 52 times, TSUN 34 times, Nebraska 34 times and Oklahoma 31 times.

To put that in perspective, if you were to randomly choose one of the 120 seasons that Ohio State has played football, there is a 68% chance that Ohio State ranks #2 or better since that season.

Ohio State has been #1 37 times, TSUN 30 times (the first 30 ranges), and Nebraska has been #1 for ranges starting in 25 different years.

To put THAT in perspective, for 65% of the 141 seasons in which college football has been played, a member of the Big Ten (as of next year to include Nebraska) ranks #1 since that season.
 
Upvote 0
Tressel Era Defense

DSD = Differential Scoring Defense

for 2001-2009...


Team_________DSD____Pts/Season____PPG__
Ohio State__0.544____188.556_____15.253
Oklahoma____0.596____238.667_____18.225
USC_________0.597____212.667_____17.054
Va. Tech____0.616____204.333_____16.220
Texas_______0.632____236.222_____18.465
Penn St.____0.644____208.889_____17.461
Alabama_____0.656____218.111_____17.580
LSU_________0.665____220.889_____17.667
Iowa________0.681____219.444_____18.343
Auburn______0.687____215.778_____18.385
Miami(FL)___0.706____220.778_____18.345


The above are ranked according to DSD.


Not only is the gap between #1 and #2 larger than ANY gap between other adjacent teams, there are only 5 pairs of adjacent teams in all of FBS with a gap that is HALF the size of the gap between Ohio State and the next best defense of the Tressel era. In fact, the only gap within 20% of the OSU-Oklahoma gap is the one between Florida International (#117) and Eastern Michigan (#118), and even that gap doesn't match the one at the top.

Ohio State is also the only team to have given up fewer than 200 points per season over the past 9 years.
 
Last edited:
Upvote 0
For those of you playing ESPN Bowl Mania or any other such game, I've applied a little maths to my confidence rankings. Like last year, I've been keeping track of every FBS team's performance using a few stats calculations.

The first is Points-Per-Play ratio (PPP Ratio, or just "Ratio"), which is calculated as:
Ratio = Offensive Points Per Play / Defensive Points Per Play Allowed

The second is Yards-Per-Point Gap (or simply "Gap"), which is calculated as:
Gap = Defensive Yards Per Point Allowed - Offensive Yards Per Point

Both yield similar results, but approach overall team efficiency in different ways. Gap favors big play offenses and bend-but-don't break defenses. Ratio favors high-powered offenses and shut-down defenses. Most teams are a mix of both, and the data reflects as such.

So, for each bowl game, I used the higher Ratio and Gap number to determine the winner, while ranking the delta between each team to determine confidence. The idea being that similar Ratio and Gap numbers suggest evenly matched teams. Having said that, SOS isn't factored, so the accuracy of this method is questionable. You'll see some interesting results below.

Here's my bowl confidence by Gap:
FQskU.gif


Here's my bowl confidence by Ratio:
LdZO6.gif


A few notes:

  • These calculations are calling UConn to pull the upset. If they win, would we be surprised?
  • I really hope I'm right on the Sugar Bowl.
  • Nebraska-Washington should be a bloodbath on paper, assuming T-Magic can hold onto the ball.
  • I personally see Stanford destroying VT, but it looks like a statistically dead-even matchup
  • Auburn has been THE outlier of the season. Their defense kills their Gap and Ratio numbers, yet here they are playing for the NC. The numbers suggest Oregon domination, but that could be due to never breaking a sweat in all but one or two games this season. I personally see both teams nuking each other to a crisp until Auburn pulls out the win.
 
Upvote 0
I had no intention of running all-of-FBS Differential numbers for 2010, but as it was the end of the Tressel era (and I had numbers for the other 9 years), I decided to finish what I started. The next few posts will give the relevant numbers, starting with DSC and DYC.

Some explanation for those new to BP-style statistics:

  1. Numbers are run for all FBS teams
  2. Stats compiled vs. non-FBS teams are thrown out
  3. I still refer to FBS as I-A occasionally. Deal with it.
  4. Primarily Differential Statistics are used.
What are Differential Statistics?

Well, for starters Differential Stats have nothing to do with differential equations. There is no calculus involved; only simple arithmetic.

If a team usually gains 400 yards per game but Nebraska holds them to 200 yards, then Big Red's Differential Total Defense (DTD) for that game is 0.5 (their opponent gained 0.5 times as many yards as they usually do). If a team were to similarly hold all of their opponents to half their usual output, then their DTD for the season would be 0.5. It's that simple. From here it should be intuitively obvious that a differential stat of 1.0 is average for both offense and defense, and that above 1.0 is above average for offense while below 1.0 is above average for defense.

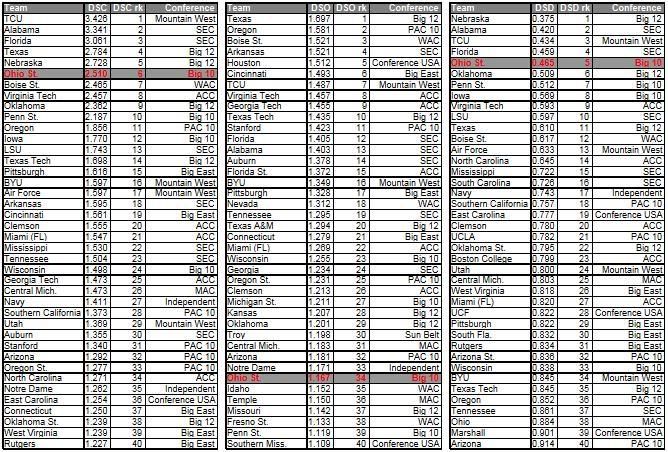
The most popular Differential Numbers around here are (as you might expect) Differential Scoring Offense (DSO) and Differential Scoring Defense (DSD). These numbers measure how adept you are at scoring compared to how good the defenses are that you face, and how good you are at stopping your opponents compared to how much your opponents score against everyone else; thus answering the question "How good are you at this whole football thing?". So if we divide DSO by DSD, we get one number, Differential Scoring Composite (DSC), that tells us how good each team is relative to the teams they played. Differential Yardage Composite does the same thing for total offense and defense.

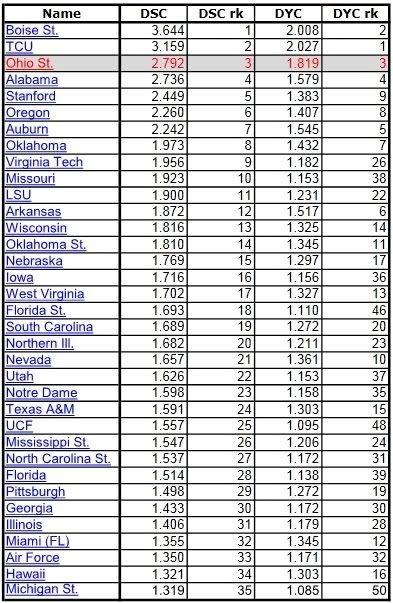
What follows is a table of the top 35 teams in DSC for the 2010 season. DYC is included for each team that made the top 35 in DSC. If there are other lists that you want to see (Differential Pass Efficiency, etc.) just ask.

composites2010.jpg
 
Last edited:
Upvote 0
It is with a heavy heart that I offer Ohio State's average rank in all traditional and differential categories for the entire Tressel era. Stats for all games against FCS teams were thrown out for ALL stats, differential or not.

TresselEraDSA-1.jpg


Where:

OFFENSE
so ≡ scoring offense
dso ≡ differential scoring offense
to ≡ total offense
dto ≡ differential total offense
ro ≡ rushing offense
dro ≡ differential rushing offense
po ≡ passing offense
dpo ≡ differential passing offense
pe ≡ passing efficiency
dpe ≡ differential passing efficiency
dypc ≡ differential yards per carry
dypa ≡ differential yards per attempt
DEFENSE
sd ≡ scoring defense
dsd ≡ differential scoring defense
td ≡ total defense
dtd ≡ differential total defense
rd ≡ rushing defense
drd ≡ differential rushing defense
pd ≡ passing defense
dpd ≡ differential passing defense
pe (def) ≡ passing efficiency (defense)
dpe (def) ≡ differential passing efficiency (defense)
dypc (def) ≡ differential yards per carry (defense)
dypa (def) ≡ differential yards per attempt (defense)

COMPOSITE

dsc ≡ differential scoring composite (dso/dsd)
dyc ≡ differential yardage composite (dto/dtd)
drc ≡ differential rushing composite (dro/drd)
dpec ≡ differential passing efficiency composite (dpe/dpe (def))
dypcc ≡ differential yards per carry composite (dypc/dypc (def))
dypac ≡ differential yards per attempt composite (dypa/dypa (def))

What is truly remarkable to me is the difference between Ohio State and everyone else in some of the defensive statistics. Some examples of what I mean:
  • Ohio State average scoring defense from 2001-2010: 15.158 points
  • Next Nearest defense (Virginia Tech) over that era: 16.651 point
  • One and a half points is bigger than the difference between any other two teams - by a lot
  • Ohio State average dsd for 2001-2010: 0.541
  • Next Nearest defense (Oklahoma): 0.612
  • The difference is the biggest between any adjacent teams in FBS and more than twice as big as any difference in the top 118 (out of 120)
 
Upvote 0
Decade of Defensive Dominance

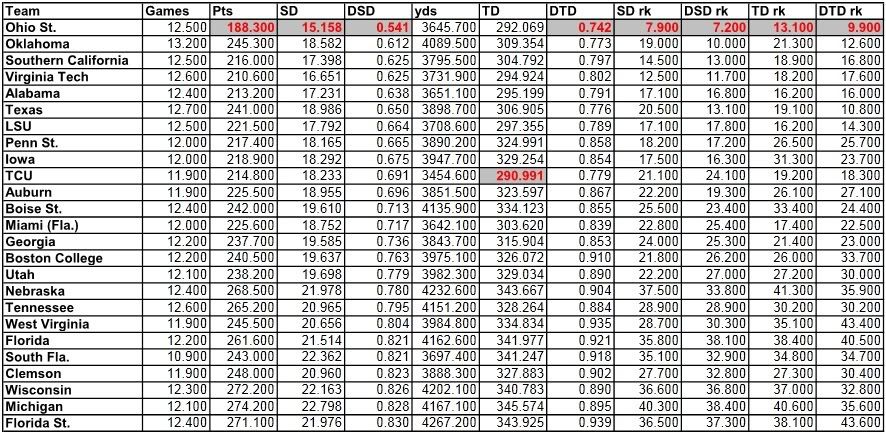
The Silver Bullets deserve more than the few bullet points I gave them in my last post. What they accomplished over the last decade is truly remarkable. Here is a screen cap of my spread sheet showing the top 25 teams in average Differential Scoring Defense for the last decade. Numbers shown in Scarlet & Grey are the best numbers for the decade. TCU leads for Total Defense; the Silver Bullets were tops in every other category.

All of the numbers on the page are averages for the past 10 years (Games is average # of games vs. FBS opponents as all others are discarded). Note especially the average rank in the various categories (last 4 columns). Ohio State is the ONLY team in FBS to have an AVERAGE rank in the top 10 in every category shown except total defense, and even there the average rank for the Buckeye defense is significantly better than everyone else.

GiveMeYourLunchMoney.jpg
 
Last edited:
Upvote 0
When it comes to defense in the first decade of the 3rd millennium, it's basically the Silver Bullets and then everyone else. Take a good look at the Differential Scoring Defense (DSD) column in the previous post. There is an 11.6% difference between #1 and #2 (Ohio State and Oklahoma). That is more than 3x the size of the difference between any other adjacent programs in the list for all 120 FBS teams.
 
Upvote 0
Back
Top