• Follow us on Twitter @buckeyeplanet and @bp_recruiting, like us on Facebook! Enjoy a post or article, recommend it to others! BP is only as strong as its community, and we only promote by word of mouth, so share away!
  • Consider registering! Fewer and higher quality ads, no emails you don't want, access to all the forums, download game torrents, private messages, polls, Sportsbook, etc. Even if you just want to lurk, there are a lot of good reasons to register!

Official Statistical Analysis Thread

muffler dragon;1973234; said:
DBB:

Have you ever run the numbers on how tOSU was during the Cooper years?

The raw numbers are not available in a format that is sufficiently convenient for my taste.

I use the numbers from HERE, which only goes back to 1999. They have PDF files that go back to 1984, but putting that into a format that my spreadsheet could easily import and crunch would require a level of tedium that even I could not endure.

I strongly suspect that, with their epic failures in big games; the Cooper era would be marked by higher ranking in traditional stats than in differential stats. I'm not willing to go through that level of tedium just to relive that pain.
 
Upvote 0
DaddyBigBucks;1973244; said:
The raw numbers are not available in a format that is sufficiently convenient for my taste.

I use the numbers from HERE, which only goes back to 1999. They have PDF files that go back to 1984, but putting that into a format that my spreadsheet could easily import and crunch would require a level of tedium that even I could not endure.

Completely understand. It wasn't a request, just an inquiry.

I strongly suspect that, with their epic failures in big games; the Cooper era would be marked by higher ranking in traditional stats than in differential stats. I'm not willing to go through that level of tedium just to relive that pain.

That makes sense. I just think back to the actual personnel that he brought in, and it would be intriguing to see what the teams actually presented data wise.
 
Upvote 0
The return of DSA

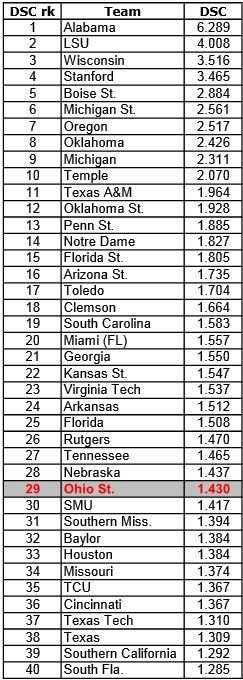
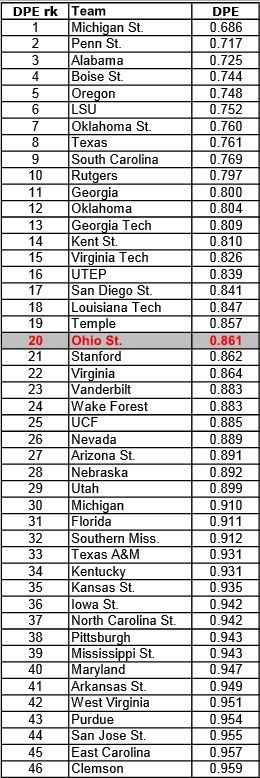
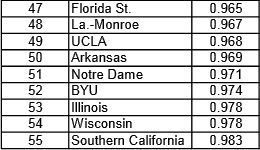
There are numerous places in this thread where Differential Scoring Composite and Differential Yardage Composite are defined. The numbers so far this season:

Week8DSC.jpg

Week8DYC.jpg
 
Upvote 0
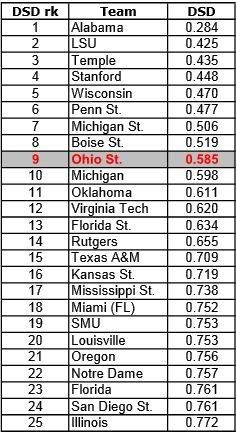
As disappointing as the defense has been this year, what with the breakdowns and missed tackles; they are still in the top 10 in Differential Scoring Defense in spite of those miscues. If they play up to their ability on Saturday night; they can give themselves a chance.

Week8DSD.jpg
 
Upvote 0
Post #305 in this thread shows that Alabama leads the nation in DSD, allowing only 28.4% of the points that their opponents usually score (with all lower division games thrown out). If they keep that number from increasing by more than a few points, it will be the best DSD the spreadsheets have ever calculated. The best number from the previous 10 years was 36.4% (2001 Miami).
 
Upvote 0
zincfinger;2234749; said:
DBB, without asking you to work it out, what would you guess the Differential Scoring and Total Defensive numbers are for OSU through seven games in 2012? 1.5? Have you seen them over 1.0 in any other year?

I'd guess that their differential scoring D is around 1 and total D around 1.1. They almost fell to 1.5 on scoring D against Indiana, by far their worst showing since the debacle in the desert; but for the season on the whole I'd guess they're right around average. ...very, very average.

The problem is that they aren't improving. The stats are getting worse, but it seems to be because teams have figured out what works against them.
 
Last edited:
Upvote 0
DaddyBigBucks;2235032; said:
I'd guess that their differential scoring D is around 1 and total D around 1.1. They almost fell to 1.5 on scoring D against Indiana, by far their worst showing since the debacle in the desert; but for the season on the whole I'd guess they're right around average. ...very, very average.

The problem is that they aren't improving. The stats are getting worse, but it seems to be because teams have figured out what works against them.
You're right. The Cal game aside (which was bad), I was remembering the scoring defense in the non-conference schedule to be worse than it actually was.

I'm sure you've answered this before, but do you include defensive and special teams scores by opponents when calculating DSD?
 
Upvote 0
zincfinger;2235064; said:
You're right. The Cal game aside (which was bad), I was remembering the scoring defense in the non-conference schedule to be worse than it actually was.

I'm sure you've answered this before, but do you include defensive and special teams scores by opponents when calculating DSD?

Yes, because it's easier that way.
 
Upvote 0
I noticed that Ohio State has BY FAR more TDs than any other B1G team, and that they also have the fewest Field Goals (welcome to Bizarro World).

This led me to look up the Red Zone offense numbers. Then I remembered that someone here (I think it was one of the BKBs) had rearranged the Red Zone rankings based on how many points teams scored in the red zone compared to how many they could have scored. That method yields some interesting results this year.

First a note on method: It was assumed that every drive that reached the red zone had a potential of 7 points. Missed extra points and 2-point conversions were thrown out for the purposes of this discussion, as the effect of these are lost in the noise of other factors.

As for the data: By the NCAA's method of ranking teams by the % of scores per drive that reaches the red zone, regardless of whether those scores were TDs or FGs, Ohio State and TSUN are tied at 20th in the nation with a few other schools. By the %-of-potential-points method, Ohio State is 2nd only to Oregon, having scored 85.7% of possible red zone points. TSUN on the other hand falls from 20th to 71st in the nation, having scored only 66.8% of possible red zone points.

Here are the raw data for Ohio State and remaining opponents.


Team__________% of Potential Points____National Rank
Ohio State__________85.7______________________2

Illinois____________64.0_____________________87
Wisconsin___________68.9_____________________57
TSUN________________66.8_____________________71

 
Upvote 0
Back
Top