
Install the app
How to install the app on iOS
Follow along with the video below to see how to install our site as a web app on your home screen.

Note: This feature currently requires accessing the site using the built-in Safari browser.
-
New here? Register here now for access to all the forums, download game torrents, private messages, polls, Sportsbook, etc. Plus, stay connected and follow BP on Instagram @buckeyeplanet and Facebook.
You are using an out of date browser. It may not display this or other websites correctly.
You should upgrade or use an alternative browser.
You should upgrade or use an alternative browser.
Official Statistical Analysis Thread
- Thread starter DaddyBigBucks
- Start date


Numbers: No Analysis Needed
10 straight road wins vs ranked teams
14 straight conference-wins by double digits
17 straight wins vs ranked conference opponents
10 straight road wins vs ranked teams
14 straight conference-wins by double digits
17 straight wins vs ranked conference opponents
Upvote
0
The History of Passing Efficiency
The recent upward trend in passing efficiency in college football in general and especially at Ohio State in particular got me wondering how we got here. I thought back over 5+ decades of following the sport and I could remember 3 periods when the passing game seemed to change. Somewhere in the 60s there was a significant uptick in the passing game; people were talking a lot about how different the game was becoming. Then again in the late 70s - early 80s there seemed to be a lot of discussion about how times had changed and offenses were so different. Now in the 21st century, it's obvious that the game has become far more complex than it was, not to mention the rules changes that have made things harder on the defenses.
I decided to look at some historical numbers, and it turns out that the history of passing efficiency agrees with my memory on when things changed and how much.
The NCAA established the current passing efficiency formula in 1979, choosing a formula that would give an average quarterback of the time a rating of 100. It was as good a time as any to establish a baseline, and it was clear the passing game was becoming much more important. As far as I've been able to find, numbers have been calculated going back to 1956. I can't speak to the accuracy of numbers before 1999, because for all seasons before that data are difficult to come by. Assuming that what I've found for the second half of the 20th century is correct...
Bob Reinhart of San Jose State is reported to have led the NCAA in passing efficiency in 1956 with a rating of 121.3
Bob Newman of Washington State did a little better in 1957 with a rating of 126.5
Apparently there was an improvement in the passing game in the late 1950s (shortly before I was born), because those are the last numbers in the 120s to lead the NCAA in PE.
If we call Reinhart's starting point in 1956 the record (due entirely to lack of data), then that "record" was broken in:
Eddie Wilson's (Arizona) rating of 134.2 in 1961 was remarkable in that it was the last rating in the 130s to ever lead the NCAA in PE.
Jerry Rhome's (Tulsa) rating of 172.6 in 1964 was truly remarkable. It was the first in the 170s, and would remain the ONLY PE rating in the 170s until Jim McMahon of BYU broke his record in 1980 with a rating of 176.9. All the more remarkable is that, while Jerry held the record the longest, Jim's record would last until Danny Wuerffel of Florida broke it in 1995 (178.4). So the record changed hands only once from 1964 until 1995.
This does not mean, however, that there were no changes going on in the passing game during that time; it just means that Jerry and Jim had remarkable, outlier seasons. In order to see the changes in the game, you have to look at the smaller numbers that were leading the NCAA during that period.
From 1970 to 1976, a PE in the 140s led the NCAA in 5 of those 7 seasons (count them if you must). In the other two, a PE in the 150s sufficed to lead the nation. That 1976 season, however, was the last season in which the 140s was good enough to lead the NCAA in PE (though Elvis Grbac's 150.2 in 1992 came perilously close).
Clearly then, the improvements in the passing game that I remember happening in the 60s and in the late 70s - early 80s are borne out by the numbers.
As we've seen:
The last time that the 120s was good enough to lead the NCAA was in 1957.
The last time that the 130s was good enough was 4 years later in 1961.
The last time that the 140s was good enough was 15 years later in 1976.
Now for the 2000s (check your 5-point-harness for structural integrity):
The last time that the 150s was good enough to lead the NCAA in PE was in 2002, 26 years after the last time the 140s was good enough.
For those who care it was Brad Banks of Iowa with a rating of 157.12.
Not only was that the last time that the 150s was good enough; the 160s would only be good enough 1 more time, and that was Tim Tebow in 2009 (164.17)
Then the 2010s happened.
The last time the 170s was good enough was in 2015 (179.08 Vernon Adams, Oregon). That was the last time that anything less than 196.39 was enough.
While the record for PE changed hands 5 times in the first 8 chances where it could have changed hands, it changed hands just once in the next 30 seasons.
As most of you know, the PE record has been set afresh in each of the last 5 seasons (though admittedly for one of those the record did not change hands because Baker Mayfield broke his own record in 2017). The Coastal Carolina QB is on pace to make it 6 years in a row.
And it's not just one area of passing, and it's not just at the top of the sport. Everything that goes into passing efficiency; completions, yards, touchdowns, interceptions, has improved dramatically since 2000.
The last time < 9 yards per attempt was enough to lead the country was in 2002.
The last time < 10 yards per attempt was enough to lead the country was in 2009. (> 10 yards per attempt had only been accomplished twice, ever, before then).
The last time < 11 yards per attempt was enough to lead the country was in 2015.
The top completion % in college football in 2000 was 64.67%. It hasn't been below 70% since. Last year it was 77.36%.
So much for what's happening at the top; let's look at the rest of the field.
The NCAA only publishes numbers for the top 100 quarterbacks (or those that qualify with a certain number of attempts, which has been at least 98 quarterbacks every year). For those who qualify or the top 100 (whichever is the smaller number is the list):
Average yards per attempt was 7.09 in 2000. Average YPA first reached 7.4 in 2009 and has been above 7.4 in every year since. It was 7.70 in 2018, 7.80 in 2019, and 7.78 in 2000.
Average completion percentage first hit 60% in 2007 and has been above that number every year since.
The last time touchdowns were thrown on fewer than 5% of pass attempts was in 2005. The % of touchdowns reached 5.9% for the first time last year (for the top 100 FBS quarterbacks - all attempts).
The first time interceptions were ever thrown on fewer than 3% of pass attempts was in 2005. The last time interceptions were thrown on MORE than 3% of pass attempts was in 2006. That number continues to drop (top 100 FBS quarterbacks - all attempts).
One last set of numbers to bring it home to Buckeye fans before I close with a graph:
While the first ever season with a passing efficiency > 170 happened in 1964, the first time a Buckeye ever did it was in 2018.
The first time a Buckeye exceeded 180 was in 2019.
CJ Stroud currently sits at 191.16.

The recent upward trend in passing efficiency in college football in general and especially at Ohio State in particular got me wondering how we got here. I thought back over 5+ decades of following the sport and I could remember 3 periods when the passing game seemed to change. Somewhere in the 60s there was a significant uptick in the passing game; people were talking a lot about how different the game was becoming. Then again in the late 70s - early 80s there seemed to be a lot of discussion about how times had changed and offenses were so different. Now in the 21st century, it's obvious that the game has become far more complex than it was, not to mention the rules changes that have made things harder on the defenses.
I decided to look at some historical numbers, and it turns out that the history of passing efficiency agrees with my memory on when things changed and how much.
The NCAA established the current passing efficiency formula in 1979, choosing a formula that would give an average quarterback of the time a rating of 100. It was as good a time as any to establish a baseline, and it was clear the passing game was becoming much more important. As far as I've been able to find, numbers have been calculated going back to 1956. I can't speak to the accuracy of numbers before 1999, because for all seasons before that data are difficult to come by. Assuming that what I've found for the second half of the 20th century is correct...
Bob Reinhart of San Jose State is reported to have led the NCAA in passing efficiency in 1956 with a rating of 121.3
Bob Newman of Washington State did a little better in 1957 with a rating of 126.5
Apparently there was an improvement in the passing game in the late 1950s (shortly before I was born), because those are the last numbers in the 120s to lead the NCAA in PE.
If we call Reinhart's starting point in 1956 the record (due entirely to lack of data), then that "record" was broken in:
- 1957
- 1958
195919601961- 1962
- 1963
- 1964
Eddie Wilson's (Arizona) rating of 134.2 in 1961 was remarkable in that it was the last rating in the 130s to ever lead the NCAA in PE.
Jerry Rhome's (Tulsa) rating of 172.6 in 1964 was truly remarkable. It was the first in the 170s, and would remain the ONLY PE rating in the 170s until Jim McMahon of BYU broke his record in 1980 with a rating of 176.9. All the more remarkable is that, while Jerry held the record the longest, Jim's record would last until Danny Wuerffel of Florida broke it in 1995 (178.4). So the record changed hands only once from 1964 until 1995.
This does not mean, however, that there were no changes going on in the passing game during that time; it just means that Jerry and Jim had remarkable, outlier seasons. In order to see the changes in the game, you have to look at the smaller numbers that were leading the NCAA during that period.
From 1970 to 1976, a PE in the 140s led the NCAA in 5 of those 7 seasons (count them if you must). In the other two, a PE in the 150s sufficed to lead the nation. That 1976 season, however, was the last season in which the 140s was good enough to lead the NCAA in PE (though Elvis Grbac's 150.2 in 1992 came perilously close).
Clearly then, the improvements in the passing game that I remember happening in the 60s and in the late 70s - early 80s are borne out by the numbers.
As we've seen:
The last time that the 120s was good enough to lead the NCAA was in 1957.
The last time that the 130s was good enough was 4 years later in 1961.
The last time that the 140s was good enough was 15 years later in 1976.
Now for the 2000s (check your 5-point-harness for structural integrity):
The last time that the 150s was good enough to lead the NCAA in PE was in 2002, 26 years after the last time the 140s was good enough.
For those who care it was Brad Banks of Iowa with a rating of 157.12.
Not only was that the last time that the 150s was good enough; the 160s would only be good enough 1 more time, and that was Tim Tebow in 2009 (164.17)
Then the 2010s happened.
The last time the 170s was good enough was in 2015 (179.08 Vernon Adams, Oregon). That was the last time that anything less than 196.39 was enough.
While the record for PE changed hands 5 times in the first 8 chances where it could have changed hands, it changed hands just once in the next 30 seasons.
As most of you know, the PE record has been set afresh in each of the last 5 seasons (though admittedly for one of those the record did not change hands because Baker Mayfield broke his own record in 2017). The Coastal Carolina QB is on pace to make it 6 years in a row.
And it's not just one area of passing, and it's not just at the top of the sport. Everything that goes into passing efficiency; completions, yards, touchdowns, interceptions, has improved dramatically since 2000.
The last time < 9 yards per attempt was enough to lead the country was in 2002.
The last time < 10 yards per attempt was enough to lead the country was in 2009. (> 10 yards per attempt had only been accomplished twice, ever, before then).
The last time < 11 yards per attempt was enough to lead the country was in 2015.
The top completion % in college football in 2000 was 64.67%. It hasn't been below 70% since. Last year it was 77.36%.
So much for what's happening at the top; let's look at the rest of the field.
The NCAA only publishes numbers for the top 100 quarterbacks (or those that qualify with a certain number of attempts, which has been at least 98 quarterbacks every year). For those who qualify or the top 100 (whichever is the smaller number is the list):
Average yards per attempt was 7.09 in 2000. Average YPA first reached 7.4 in 2009 and has been above 7.4 in every year since. It was 7.70 in 2018, 7.80 in 2019, and 7.78 in 2000.
Average completion percentage first hit 60% in 2007 and has been above that number every year since.
The last time touchdowns were thrown on fewer than 5% of pass attempts was in 2005. The % of touchdowns reached 5.9% for the first time last year (for the top 100 FBS quarterbacks - all attempts).
The first time interceptions were ever thrown on fewer than 3% of pass attempts was in 2005. The last time interceptions were thrown on MORE than 3% of pass attempts was in 2006. That number continues to drop (top 100 FBS quarterbacks - all attempts).
One last set of numbers to bring it home to Buckeye fans before I close with a graph:
While the first ever season with a passing efficiency > 170 happened in 1964, the first time a Buckeye ever did it was in 2018.
The first time a Buckeye exceeded 180 was in 2019.
CJ Stroud currently sits at 191.16.
Last edited:
Upvote
0
There doesn’t seem to be a good place to put this post, but this thread seems a good place to stuff things that are fascinating to me but that few others will care about.
The rest of the season has some unusual scheduling anomalies.
PSU will be the last team Ohio State faces who will have played only one of Ohio State’s previous opponents. That’s not the unusual part, the last game where there are no common opponents or only one will often happen at this time of year.
The weirdness does start next week though. It will be the first of two consecutive weeks in which Ohio State’s next opponent hosts Ohio State’s opponent for the week after that.
10/30: OSU hosts PSU - one common opponent (last such game)
10/30: Nebraska hosts Purdue
11/6: OSU-Nebraska
11/13: OSU-Purdue
11/6: Purdue hosts Sparty
11/13: OSU-Purdue
11/20: OSU-Sparty
Another common-opponent anomaly regarding UNL/PU: Both of them lost to Minnesota this month, but will have faced no other of Ohio State’s previous opponents. So they face each other and then play Ohio State with only each other and Minnesota as common opponents with the Buckeyes.
That game on the 20th with Sparty will have 5 common opponents, a bit higher than usual for the penultimate game of the year. Higher because, of the 3 West division cross-overs each team will have faced, two of them will be common: Nebraska and Purdue.
The Game will have 6 common opponents, the other East division teams and Nebraska.
So, common (previously played) opponents for the rest of the year:
10/30: 1
11/6: 2
11/13: 2
11/20: 5
11/27: 6
That pattern is common for this time of year; how we get there, not so much.
EDIT: The Nits played Indiana - duh
Last edited:
Upvote
0
This one is going to be a two parter
It's also going to be weird
Very weird (especially the second part)
This started with me gaping at Ohio State's third down defense statistics (they're bloody awful, for those of you who slept through the first two thirds of the regular season). I got to thinking, "What in the scarlet hell could make this defense so bad on third down?".
The numbers that I found... to the extent that they tell any story at all, the story they tell comports with the sense of it that you get from watching this sport for decades: Getting off the field on third down is 90% attitude.
The first thing I thought of was pass rush. But no... there isn't a readily available data set that I'm aware of that will give me information on pass rush. What's important is to be able to get there with 4, and information on sacks alone doesn't tell you whether or not the sacks came from blitzing. I ran some correlations and, sure enough, the correlation between sacks and 3rd down conversion is pretty meh (0.419)
Since I had the spreadsheet setup for doing correlations, it took just a few seconds to get a few more numbers.

So defenses that can stop rushing touchdowns are also good at stopping 3rd down conversions.

Yeah... Not exactly breaking news there.
What I found interesting was that completion percentage allowed has a higher correlation than pass efficiency allowed. This is interesting for a couple of reasons, one of which I'll return to in the next post. For now, I'll just focus on the fact that, Ohio State is 32nd in the nation in yards per attempt allowed (much lower correlation) and 64th in the nation in completion percentage allowed (higher correlation to 3rd down %), so for whatever reason those correlations are what they are, whether there is any causation there or not, the tendency holds as much for Ohio State as it does for CFB in general.
*all the correlations in this post and the next are absolute values
It's also going to be weird
Very weird (especially the second part)
This started with me gaping at Ohio State's third down defense statistics (they're bloody awful, for those of you who slept through the first two thirds of the regular season). I got to thinking, "What in the scarlet hell could make this defense so bad on third down?".
The numbers that I found... to the extent that they tell any story at all, the story they tell comports with the sense of it that you get from watching this sport for decades: Getting off the field on third down is 90% attitude.
The first thing I thought of was pass rush. But no... there isn't a readily available data set that I'm aware of that will give me information on pass rush. What's important is to be able to get there with 4, and information on sacks alone doesn't tell you whether or not the sacks came from blitzing. I ran some correlations and, sure enough, the correlation between sacks and 3rd down conversion is pretty meh (0.419)
Since I had the spreadsheet setup for doing correlations, it took just a few seconds to get a few more numbers.
So defenses that can stop rushing touchdowns are also good at stopping 3rd down conversions.
Yeah... Not exactly breaking news there.
What I found interesting was that completion percentage allowed has a higher correlation than pass efficiency allowed. This is interesting for a couple of reasons, one of which I'll return to in the next post. For now, I'll just focus on the fact that, Ohio State is 32nd in the nation in yards per attempt allowed (much lower correlation) and 64th in the nation in completion percentage allowed (higher correlation to 3rd down %), so for whatever reason those correlations are what they are, whether there is any causation there or not, the tendency holds as much for Ohio State as it does for CFB in general.
*all the correlations in this post and the next are absolute values
Upvote
0
The above got me wondering what the correlations are for offense. What offensive stats have the highest correlation to 3rd down conversion percentage?

Remember how completion percentage had a higher correlation to 3rd down conversion defense than passing efficiency?
Yeah... It's the other way around for the offense. By a LOT.
Same with yards per attempt. It has a significantly HIGHER correlation for the offense than completion percentage.
While I will allow better minds than mine (so pretty much the whole board) to speculate on why any of this is what it is, I will offer this.
If it really is mostly about completion percentage for defenses, then what can defenses actively do to stop completion percentage? If only there were a stat for that.
Oh wait... there is. It's called Passes Defended, and it's simply the interceptions and pass break ups combined.
Ohio State shares the lead in all of FBS in that stat at 6 passes defended per game. Seriously... no one is better at that.
Sure, some of this is about consistency, and absolutely... some of this is about luck. But I bet you that focusing too much on that defensive correlation to completion percentage would have you chasing statistical ghosts. I bet it really doesn't mean all that much at the end of the day. It's worth noting sure; but it's not worth dwelling on.
Some day, when I have the time, I might go back through multiple years and see what the correlations are. Right now, I'm expecting they'll be different for different years.
The reason is something I mentioned early in the previous post: attitude.
Getting off the field on 3rd down is about your mind set. It's about having IT, whatever IT is. It's about the human element of football that defies being quantified (though red zone and 3rd down performance can give you a glimpse of it). If I may use an example from the other side of the ball, it's the reason that Craig Krenzel was a national champion quarterback who was never in any danger of winning a Heisman Trophy. When the game was on the line, he could be counted on.
2014 was partially about a defense that had IT when it counted. They certainly did not have IT for the entire year; so we have all seen that IT can be acquired over the course of a season.
So at some point before the playoff, or better yet
Upvote
0
What in the Scarlet Hell is going on in the second quarter?
I can't be the only one who's been asking that question this year. The second quarter has not been kind to the Buckeyes. This post has no intention of trying to figure out why; I'm hoping you guys will tell me. I just thought I'd post some numbers that will caption our pain and illustrate that it wasn't like this last year.
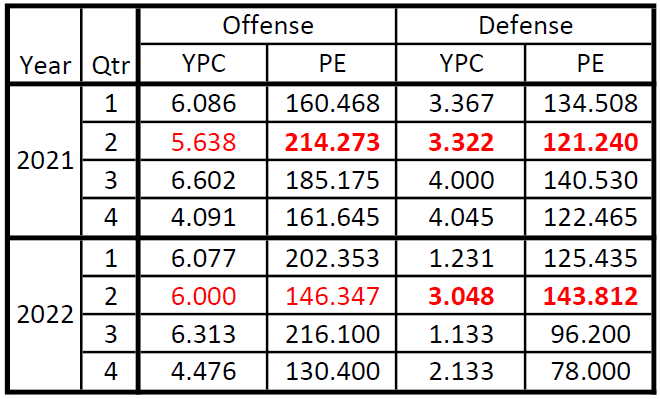
All 2nd quarter numbers for both this year and last year are in red. Numbers that were the best in the 2nd quarter in 2021 are in bold. Numbers that were the worst in the 2nd quarter in 2022 are in bold.
As always, YPC = Yards per Carry and PE = Passing Efficiency
The weirdest bit is that the rushing offense is a bit of an outlier in both cases. As you might expect, when the other team knows you need to run (the 4th quarter) the YPC is down for both years (though notably higher in 2022 so far). For the other 3 quarters, rushing offense was the one category where the 2021 Buckeyes were worst in the 2nd quarter, and by a larger margin than the 2022 Buckeyes. The '22 Buckeyes really don't have a drop-off in rushing offense from the first quarter to the second. That is certainly not the case for the other 3 categories here.
While the 2022 passing efficiency was worst in the 4th quarter, the simple truth is that's because of what the passing game has been trying to do (and not trying to do) in the 4th quarter. CJ has been 5/6 for 41 yards in the 4th, with no touchdowns. The truth is CJ has been money in the 4th, he just hasn't been asked to go downfield with the ball much in the 4th. His longest pass in the 4th went 12 yards. The longest passes in the other quarters have gone 45, 48 and 51 yards respectively. So with a hard cap on what it's possible for PE to be in the 4th, it's clear that the 2nd quarter has been by far CJ's worst quarter this year; it is the only one of the first 3 quarters in which his PE is NOT over 200. Conversely, in 2021, the 2nd quarter was the only quarter in which CJ's PE WAS over 200. So question #1 is: What on earth would make CJ best in the 2nd quarter in 2021 and worst in the 2nd quarter in 2022?
Question #2 is the same, but about the defense as a whole. The 2nd quarter was the best for the 2021 defense against both run and pass. It is the worst quarter in both quarters in 2022. And the differences are every bit as drastic in the numbers as they appeared on the field.
The 2nd quarter pass defense this year is the only quarter that is actually WORSE than last year. The other quarters are better. By a lot. In fact, it is remarkable how much better the 2nd half pass defense is this year than last year. That reminds me of some Mark Dantonio defenses, but that's a different post for a different day.
The rush defense on the other hand is better in EVERY quarter this year, but the only quarter where it's close is the second quarter. The 2022 silver bullets are much worse against the run in quarter #2 than in any other quarter.
Hopefully one of you guys can help me understand why the Buckeyes are struggling in the 2nd quarter this year; but the fact that they are struggling (relatively speaking) is undeniable. Perhaps this is just an early season thing and we'll see it turn around on Saturday.
That would require the inverse trend for Toledo to also get turned around. In an odd coincidence, the Toledo Rockets are actually at their best in the 2nd quarter this year in both passing offense and passing defense, and by a significant margin.
No matter how things go in the first quarter, this game will have my full attention when the 2nd quarter starts Saturday evening.
Go Bucks
I can't be the only one who's been asking that question this year. The second quarter has not been kind to the Buckeyes. This post has no intention of trying to figure out why; I'm hoping you guys will tell me. I just thought I'd post some numbers that will caption our pain and illustrate that it wasn't like this last year.
All 2nd quarter numbers for both this year and last year are in red. Numbers that were the best in the 2nd quarter in 2021 are in bold. Numbers that were the worst in the 2nd quarter in 2022 are in bold.
As always, YPC = Yards per Carry and PE = Passing Efficiency
The weirdest bit is that the rushing offense is a bit of an outlier in both cases. As you might expect, when the other team knows you need to run (the 4th quarter) the YPC is down for both years (though notably higher in 2022 so far). For the other 3 quarters, rushing offense was the one category where the 2021 Buckeyes were worst in the 2nd quarter, and by a larger margin than the 2022 Buckeyes. The '22 Buckeyes really don't have a drop-off in rushing offense from the first quarter to the second. That is certainly not the case for the other 3 categories here.
While the 2022 passing efficiency was worst in the 4th quarter, the simple truth is that's because of what the passing game has been trying to do (and not trying to do) in the 4th quarter. CJ has been 5/6 for 41 yards in the 4th, with no touchdowns. The truth is CJ has been money in the 4th, he just hasn't been asked to go downfield with the ball much in the 4th. His longest pass in the 4th went 12 yards. The longest passes in the other quarters have gone 45, 48 and 51 yards respectively. So with a hard cap on what it's possible for PE to be in the 4th, it's clear that the 2nd quarter has been by far CJ's worst quarter this year; it is the only one of the first 3 quarters in which his PE is NOT over 200. Conversely, in 2021, the 2nd quarter was the only quarter in which CJ's PE WAS over 200. So question #1 is: What on earth would make CJ best in the 2nd quarter in 2021 and worst in the 2nd quarter in 2022?
Question #2 is the same, but about the defense as a whole. The 2nd quarter was the best for the 2021 defense against both run and pass. It is the worst quarter in both quarters in 2022. And the differences are every bit as drastic in the numbers as they appeared on the field.
The 2nd quarter pass defense this year is the only quarter that is actually WORSE than last year. The other quarters are better. By a lot. In fact, it is remarkable how much better the 2nd half pass defense is this year than last year. That reminds me of some Mark Dantonio defenses, but that's a different post for a different day.
The rush defense on the other hand is better in EVERY quarter this year, but the only quarter where it's close is the second quarter. The 2022 silver bullets are much worse against the run in quarter #2 than in any other quarter.
Hopefully one of you guys can help me understand why the Buckeyes are struggling in the 2nd quarter this year; but the fact that they are struggling (relatively speaking) is undeniable. Perhaps this is just an early season thing and we'll see it turn around on Saturday.
That would require the inverse trend for Toledo to also get turned around. In an odd coincidence, the Toledo Rockets are actually at their best in the 2nd quarter this year in both passing offense and passing defense, and by a significant margin.
No matter how things go in the first quarter, this game will have my full attention when the 2nd quarter starts Saturday evening.
Go Bucks
Upvote
0
Zurp
I have misplaced my pants.
Hopefully one of you guys can help me understand why the Buckeyes are struggling in the 2nd quarter this year; but the fact that they are struggling (relatively speaking) is undeniable. Perhaps this is just an early season thing and we'll see it turn around on Saturday.
I think you're looking for a pattern when only 2 data points are available. Yeah - I know that your data is looking at all of the plays in both 2nd quarters Ohio State has had this year, but I think it's a lot like a series of coin flips. Flip a coin 10,000 times and then look at the results. You'll find some series of 6, 7, 8, 10, maybe 14 heads in a row. It's easy to say, "Bah! There's something wrong with the coin - it shouldn't hit heads this many times in a row." That "strange" data might make your local average of heads vs tails look goofy for a while.
I guess my point is that coincidences may appear weird, but they're just coincidences. And it's actually weird when you can't find any coincidences.
Let's give it 2-3 more games.
Or... maybe the 2nd quarter is when the other team has figured out Ohio State's game plan, and have made their adjustments. 3rd quarter is for Ohio State to make their own adjustments....
Upvote
0
I think you're looking for a pattern when only 2 data points are available. Yeah - I know that your data is looking at all of the plays in both 2nd quarters Ohio State has had this year, but I think it's a lot like a series of coin flips. Flip a coin 10,000 times and then look at the results. You'll find some series of 6, 7, 8, 10, maybe 14 heads in a row. It's easy to say, "Bah! There's something wrong with the coin - it shouldn't hit heads this many times in a row." That "strange" data might make your local average of heads vs tails look goofy for a while.
I guess my point is that coincidences may appear weird, but they're just coincidences. And it's actually weird when you can't find any coincidences.
Let's give it 2-3 more games.
Or... maybe the 2nd quarter is when the other team has figured out Ohio State's game plan, and have made their adjustments. 3rd quarter is for Ohio State to make their own adjustments....
There is a pattern... but it is purely numerical. I agree that it is probably a coincidence, especially where Stroud's performance is concerned. The defense might be better explained by your last paragraph, but we'll need more data for that. By the end of the season, I expect that this won't even be a topic of conversation, but Saturday will tell us if that's true or not. That's why i'll be dialed in for the 2nd quarter on saturday; I want to see that next data point to try to figure out if there's anything to this.
I will also be very interested in seeing whether Knowles' defense is the 2nd half killer that I hope they are. It's still too early, which is why I said that's a different post for a different day. But my gut tells me that Knowles' is going to have the best 2nd half defense we've seen since Dantonio. If that trend continues, there will definitely be more posts about it in this thread. I expect the 2nd quarter performance discussion to be in the rear view mirror before Halloween
Upvote
0
I think that so far this year, the 2nd Quarter is when Ohio State has gotten past their scripted plays and the coaches are trying to figure themselves out and the team is adjusting on the fly. Harder to adjust on the fly without Olave, Wilson and Ruckert to start this season imo, but more reps with who we've got will change that. Hopefully.
The 3rd quarter is the one that I'm going to pay closer attention to after the coaches have had an entire half to play and made adjustments at halftime. If we start going badly in the 3rd quarter, I'm going to be concerned.
The 3rd quarter is the one that I'm going to pay closer attention to after the coaches have had an entire half to play and made adjustments at halftime. If we start going badly in the 3rd quarter, I'm going to be concerned.
Last edited:
Upvote
0
What in the Scarlet Hell is going on in the second quarter?
I can't be the only one who's been asking that question this year. The second quarter has not been kind to the Buckeyes. This post has no intention of trying to figure out why; I'm hoping you guys will tell me. I just thought I'd post some numbers that will caption our pain and illustrate that it wasn't like this last year...
More second quarter weirdness
The Buckeyes have scored zero rushing touchdowns in the second quarter. They have scored multiple rushing touchdown in each of the other three quarters.
The Buckeyes have given up multiple (2) rushing touchdowns in the second quarter. They have given up zero rushing touchdowns in each of the other three quarters.
Upvote
0
More second quarter weirdness
The Buckeyes have scored zero rushing touchdowns in the second quarter. They have scored multiple rushing touchdown in each of the other three quarters.
The Buckeyes have given up multiple (2) rushing touchdowns in the second quarter. They have given up zero rushing touchdowns in each of the other three quarters.

Upvote
0