While I'm obsessed with numbers, I'm probably even more obsessed with definitions. Most people are very sloppy with definitions; most arguments stem from this in my opinion.
One of these sloppy definitions that most people just accept (and that I have let slide without comment until now) is what we call "Scoring Offense". The number that is kept would be better characterized as "scoring", as it includes scoring done by defense and special teams too, not just scoring by the offense.
The reason I bring this up is that it occurred to me that Ohio State's offense is carrying all of the water for the team in terms of scoring this year. Other teams (looking at you Iowa) are getting a lot more help from defense and special teams. There is also the small matter of Ohio State putting the offense in neutral and coasting for the 4th quarter of most games; the Buckeyes are the only team to have won every game by double digits this year.
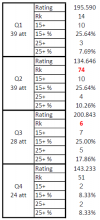
So I decided to compile offensive touchdowns scored by each team in the first 3 quarters of each of their games. Below is a table of the top 32 teams in this metric (Offensive Touchdowns per game in quarters 1-3)

Please excuse the sloppy numbering; I didn't bother to indicate ties.
Iowa is dead last in FBS at 0.667 Offensive Touchdowns per game in quarters 1-3.
Ohio State's lead over Tennessee (2nd place) in Scoring is just 1.167 points per game. If you extrapolate the above to 4 quarter games, Brutus is outscoring Smoky at a rate of 7.778 points per game during the first 3 quarters.
The Buckeyes and Vols are 2 of 23 teams that are tied for 41st place in Offensive Touchdowns Scored in the 4th Quarter at exactly 1 per game, so the difference shown above comes purely from the omission of defensive and special teams scores and not at all from the omission of 4th quarter scoring.
The omission of the 4th quarter did affect some teams more than it did the Buckeyes though. The 32nd ranked team in the above graph (tied for 30th actually) is tied for 2nd place in Offensive Touchdowns Scored in the 4th Quarter. That's how they roll I guess.
By quarter, the Buckeye Offense is #1 at scoring touchdowns in both the 1st and 3rd quarters, 41st in the 4th quarter as indicated above, and is in a 5-way tie for 20th place in the 2nd quarter.
EDIT: Based on the above, Ohio State is scoring at a rate of 54.44 points per game during the first 3 quarters of games.
One of these sloppy definitions that most people just accept (and that I have let slide without comment until now) is what we call "Scoring Offense". The number that is kept would be better characterized as "scoring", as it includes scoring done by defense and special teams too, not just scoring by the offense.
The reason I bring this up is that it occurred to me that Ohio State's offense is carrying all of the water for the team in terms of scoring this year. Other teams (looking at you Iowa) are getting a lot more help from defense and special teams. There is also the small matter of Ohio State putting the offense in neutral and coasting for the 4th quarter of most games; the Buckeyes are the only team to have won every game by double digits this year.
So I decided to compile offensive touchdowns scored by each team in the first 3 quarters of each of their games. Below is a table of the top 32 teams in this metric (Offensive Touchdowns per game in quarters 1-3)
Please excuse the sloppy numbering; I didn't bother to indicate ties.
Iowa is dead last in FBS at 0.667 Offensive Touchdowns per game in quarters 1-3.
Ohio State's lead over Tennessee (2nd place) in Scoring is just 1.167 points per game. If you extrapolate the above to 4 quarter games, Brutus is outscoring Smoky at a rate of 7.778 points per game during the first 3 quarters.
The Buckeyes and Vols are 2 of 23 teams that are tied for 41st place in Offensive Touchdowns Scored in the 4th Quarter at exactly 1 per game, so the difference shown above comes purely from the omission of defensive and special teams scores and not at all from the omission of 4th quarter scoring.
The omission of the 4th quarter did affect some teams more than it did the Buckeyes though. The 32nd ranked team in the above graph (tied for 30th actually) is tied for 2nd place in Offensive Touchdowns Scored in the 4th Quarter. That's how they roll I guess.
By quarter, the Buckeye Offense is #1 at scoring touchdowns in both the 1st and 3rd quarters, 41st in the 4th quarter as indicated above, and is in a 5-way tie for 20th place in the 2nd quarter.
EDIT: Based on the above, Ohio State is scoring at a rate of 54.44 points per game during the first 3 quarters of games.
Last edited:
Upvote
0