• Follow us on Twitter @buckeyeplanet and @bp_recruiting, like us on Facebook! Enjoy a post or article, recommend it to others! BP is only as strong as its community, and we only promote by word of mouth, so share away!
  • Consider registering! Fewer and higher quality ads, no emails you don't want, access to all the forums, download game torrents, private messages, polls, Sportsbook, etc. Even if you just want to lurk, there are a lot of good reasons to register!

2020 tOSU Recruiting Discussion

Some of my feelings about this hypothetical class are colored by my belief that Ohio State is not going to sign any of the following: Julian Fleming, Bijan Robinson, Clark Phillips III, and Michael Carmody. There go four of the highest-ranked members of the class, and three of them play those positions of need that you mentioned.

Even if Ohio State somehow managed to sign the entire 28-man class posted by HotMic, that class would still not qualify as "great" in my book. The overall class score - using current 247 Composite rankings - would be 311.31. That is a great score, but it is largely due to the size of the class. The average per recruit would be 92.49, which is significantly lower than Ohio State's classes of 2017 (94.59) and 2018 (94.29), and also lower than the projected classes for Alabama, Clemson, and Georgia.

This hypothetical class is also heavy on sleepers and projects (James, Leroux, Lachey, Edwards, Redman, Craig, Lewis, Williams) and players without positions (Thomas, Edwards, Trayanum, Williams, Cavazos, Martinez). You always need to take fliers on a few kids, but this class has a dozen of them.

Let's look at the class this way....

First, eliminate the kids least likely to sign with Ohio State (Fleming, Robinson, Phillips, Carmody).

Second, eliminate the borderline prospects with no serious connection to Ohio State and who have not named Ohio State a leader (Redman, Craig, Lewis, Banks).

Third, add in Miyan Williams (Cincinnati Winton Woods) and Jutahn McClain (Fairfield), who IMO are likely to end up in this class.

Fourth, arrange the recruits by the positions that you know they will play in college.

Now we are at 22 recruits, arranged as follows:

QB: Jack Miller (.9646)
RB: Miyan Williams (.8628)
HB: Michael Drennen II (.9307)
WR: Marcus Rosemy (.9818)
WR: Gee Scott, Jr. (.9639)
WR: Jaxon Smith-Njigba (.9402)
TE: Luke Lachey (.8577)
OT: Paris Johnson, Jr. (.9980)
OT: Trey Leroux (.8366)
OT: Reese Atteberry (.8944)
INT: Luke Wypler (.9729)
INT: Jakob James (.8516)
DE: Darrion Henry (.9777)
_S: Lathan Ransom (.9621)
CB: Henry Gray (.9607)

UNK: Jaheim Thomas (.9085) (DE or LB)
UNK: Lejond Cavazos (.9057) (CB or safety)
UNK: DeaMonte Trayanum (.8955) (RB or LB)
UNK: Jutahn McClain (.8889) (RB, HB, WR, DB)
UNK: Kourt Williams II (.8886) (Safety or LB)
UNK: Cameron Martinez (.8839) (HB, WR, DB)
UNK: Terah Edwards (.8466) (INT or DT)

My hypothetical class has an overall score of 286.37, with an average per recruit of 91.70, with room to add up to three players late in the process (another OL, another DL, and maybe a 5-star kid like Julian Fleming).

An average player rating of 92.49 would be top 5 in any class going back to at least 2013. I'm not sure how that wouldn't classify as great. If you think 92.49 is "significantly lower" than 94.59, Clemson's last class averaged 89.79. Georgia, with five 5*s and 14*s had an average rating of 93.32 last year.

I would disagree with your assessment that an average of 92.49 wouldn't be a great class.
 
Upvote 0
If you think 92.49 is "significantly lower" than 94.59
The difference between 94.59 (class of 2017) and 92.49 (hypothetical class of 2020) is 2.10

The 247 Composite rankings are complete going back to 2009.

Since 2009, Ohio State has signed 232 recruits with an average rating of 91.59

Since 2009, Michigan has signed 227 recruits with an average rating of 89.50

The difference between 91.59 (Ohio State) and 89.50 (Michigan) is 2.09

Since 2009, Ohio State is 9-1 against Michigan, and has outscored Michigan 367 to 246 (more than 12 points per game).

In recruiting, a 2.10 difference between classes is very significant indeed.
 
Upvote 0
The difference between 94.59 (class of 2017) and 92.49 (hypothetical class of 2020) is 2.10

The 247 Composite rankings are complete going back to 2009.

Since 2009, Ohio State has signed 232 recruits with an average rating of 91.59

Since 2009, Michigan has signed 227 recruits with an average rating of 89.50

The difference between 91.59 (Ohio State) and 89.50 (Michigan) is 2.09

Since 2009, Ohio State is 9-1 against Michigan, and has outscored Michigan 367 to 246 (more than 12 points per game).

In recruiting, a 2.10 difference between classes is very significant indeed.


I'll chime in and say this: The difference between 94.59 and 92.49 might be 2.10 but it only means a few spots difference in the overall recruiting rankings, which still puts OSU in elite company each year with Bama, Clemson and UGA.

The 2.01 difference and talent gap you are talking about between OSU and *ichigan is a lot more staggering because now you are talking about a lot more projects and lack of high-end, elite-level talent in the class that is going elsewhere and clumps you in with the majority of other Power5 conference foes, like in *ichigan's case.

Some of that is talent and some of it has to be attributed to poor coaching. Let's not pretend like the higher-end talent on *ichigan's roster that chose to go up north instead of choosing OSU wouldn't have been received with open-arms @ Ohio State and couldn't find a spot on OSU's roster if they wouldn't have chosen the skunkbears. Point taken though...... they do have quite a few of low * specials and a recent trend of finding these diamond in the rough foreigners that presumably fit the Hairball's system.
 
Last edited:
Upvote 0
The difference between 94.59 (class of 2017) and 92.49 (hypothetical class of 2020) is 2.10

The 247 Composite rankings are complete going back to 2009.

Since 2009, Ohio State has signed 232 recruits with an average rating of 91.59

Since 2009, Michigan has signed 227 recruits with an average rating of 89.50

The difference between 91.59 (Ohio State) and 89.50 (Michigan) is 2.09

Since 2009, Ohio State is 9-1 against Michigan, and has outscored Michigan 367 to 246 (more than 12 points per game).

In recruiting, a 2.10 difference between classes is very significant indeed.

So this hypothetical 2020 class would be even greater than what OSU has averaged since 2009 by almost a full point?? Sign me up.
 
Upvote 0
There is only 1 program signing 20+ top 300 kids annually and it isn't OSU, even when Urban was here..... so when recruits come out 2 years prior to their actual signing, and have OSU in their top 5, we (me included) get all excited about landing a class full of all 5* and high 4* recruits, when in reality it isn't likely to happen. If Coach Day can continue to keep OSU in/around the top 5 in recruiting rankings each year, I think OSU will be just fine.
 
Upvote 0
The difference between 94.59 (class of 2017) and 92.49 (hypothetical class of 2020) is 2.10

The 247 Composite rankings are complete going back to 2009.

Since 2009, Ohio State has signed 232 recruits with an average rating of 91.59

Since 2009, Michigan has signed 227 recruits with an average rating of 89.50

The difference between 91.59 (Ohio State) and 89.50 (Michigan) is 2.09

Since 2009, Ohio State is 9-1 against Michigan, and has outscored Michigan 367 to 246 (more than 12 points per game).

In recruiting, a 2.10 difference between classes is very significant indeed.

At the risk of having to defend Michigan, I'm going to forfeit my argument and accept defeat.
 
Upvote 0
The difference between 94.59 (class of 2017) and 92.49 (hypothetical class of 2020) is 2.10

The 247 Composite rankings are complete going back to 2009.

Since 2009, Ohio State has signed 232 recruits with an average rating of 91.59

Since 2009, Michigan has signed 227 recruits with an average rating of 89.50

The difference between 91.59 (Ohio State) and 89.50 (Michigan) is 2.09

Since 2009, Ohio State is 9-1 against Michigan, and has outscored Michigan 367 to 246 (more than 12 points per game).

In recruiting, a 2.10 difference between classes is very significant indeed.

Are they that significant? Clemson has numbers very similar to Michigan's going back to 2009.

In fact, their numbers are closer to Michigan's than they are to OSU or Bama.
 
Upvote 0
dude knows exactly who to choose as examples to make a point :lol:

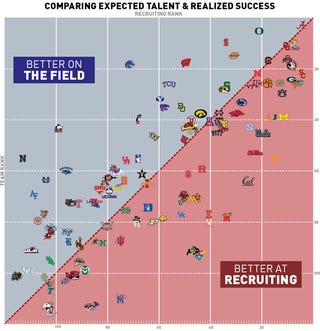
Different time frame, measures of on-the-field success and recruiting quality, but then as now, Michigan is poo poo with one of the largest negative deviations from this regression. :rofl:

v8oln0qsi9qkmfs3jg0d.jpg


https://deadspin.com/chart-which-ncaa-football-teams-outplay-their-recruit-1640831522
 
Upvote 0
Different time frame, measures of on-the-field success and recruiting quality, but then as now, Michigan is poo poo with one of the largest negative deviations from this regression. :rofl:

v8oln0qsi9qkmfs3jg0d.jpg


https://deadspin.com/chart-which-ncaa-football-teams-outplay-their-recruit-1640831522
I don’t understand how Boise State, Wisconsin, Stanford, Oklahoma State, Oregon, South Carolina, and Florida State are equivalent or greater than Ohio State on the y-axis (better on the field) of that graph.
 
Upvote 0
Back
Top