mross34
Rock, Flag, and Eagle
In short, yes. Well... kind of.
So there's been a lot of talk on the internets about how this years combine was slower. And I don't know whether it was sheer boredom or the fact that they don't let me make enough graphs at work, but when I read OregonBuckeye's post in a thread about how you should shave .05-.1 seconds off everyone's 40 times this year, it got me thinking whether or not this was true or not.
So I collected the most officialest data I could from around the internet of 40 times for RBs, WRs and DBs for the past 4 years. 2006 was a little harder to find, so the sample size is a little smaller.
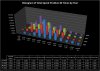
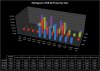
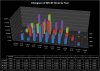
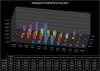
Attached are 4 histograms(What's a histogram you ask?). One represents the distribution of all 3 positions 40 times. One is for RBs, one is for WRs, and one is for DBs.
2009 data: Courtesy of footballfutures.com
113 players ran: 23 RBs, 36 WRs, 54 DBs.
2008 data: Courtesy of thehuddle.com
133 players ran: 33 RBs, 46 WRs, 54 DBs.
2007 data: Courtesy of mynfldraft.com
118 players ran: 26 RBs, 43 WRs, 49 DBs.
2006 data: Courtesy of thehogs.net
74 players ran: 18 RBs, 30 WRs, 26 DBs.
Perspective isn't consistent through each graph, so you can see as much data as possible. The graphs are kind of dizzying at first but if you give it a few minutes, you can get a pretty good idea of whats going on.
Conclusions
This was probably way too much work for what it is, but I hope you guys enjoy.
So there's been a lot of talk on the internets about how this years combine was slower. And I don't know whether it was sheer boredom or the fact that they don't let me make enough graphs at work, but when I read OregonBuckeye's post in a thread about how you should shave .05-.1 seconds off everyone's 40 times this year, it got me thinking whether or not this was true or not.
So I collected the most officialest data I could from around the internet of 40 times for RBs, WRs and DBs for the past 4 years. 2006 was a little harder to find, so the sample size is a little smaller.
Attached are 4 histograms(What's a histogram you ask?). One represents the distribution of all 3 positions 40 times. One is for RBs, one is for WRs, and one is for DBs.
2009 data: Courtesy of footballfutures.com
113 players ran: 23 RBs, 36 WRs, 54 DBs.
2008 data: Courtesy of thehuddle.com
133 players ran: 33 RBs, 46 WRs, 54 DBs.
2007 data: Courtesy of mynfldraft.com
118 players ran: 26 RBs, 43 WRs, 49 DBs.
2006 data: Courtesy of thehogs.net
74 players ran: 18 RBs, 30 WRs, 26 DBs.
Perspective isn't consistent through each graph, so you can see as much data as possible. The graphs are kind of dizzying at first but if you give it a few minutes, you can get a pretty good idea of whats going on.
Conclusions
- Looks like Oregon was about right. The distribution seems to be shifted .05 seconds slower this year than the past.
- This year's WR class is FAST. Distribution doesn't seem to affect them too much
- This year's DB class looks slow as molasses.
- Player's are getting smarter. Those who know they won't run as well seem to be sitting this out more. The shift in times didn't really affect the very bottom of the list.
This was probably way too much work for what it is, but I hope you guys enjoy.