


Chad Peltier
Guest
Big plays and red zone success will determine Ohio State vs. Oklahoma
Chad Peltier via our friends at Land-Grant Holy Land
Visit their fantastic blog and read the full article (and so much more) here
The Buckeyes will need big passes and a stout red zone defense to beat the Sooners.
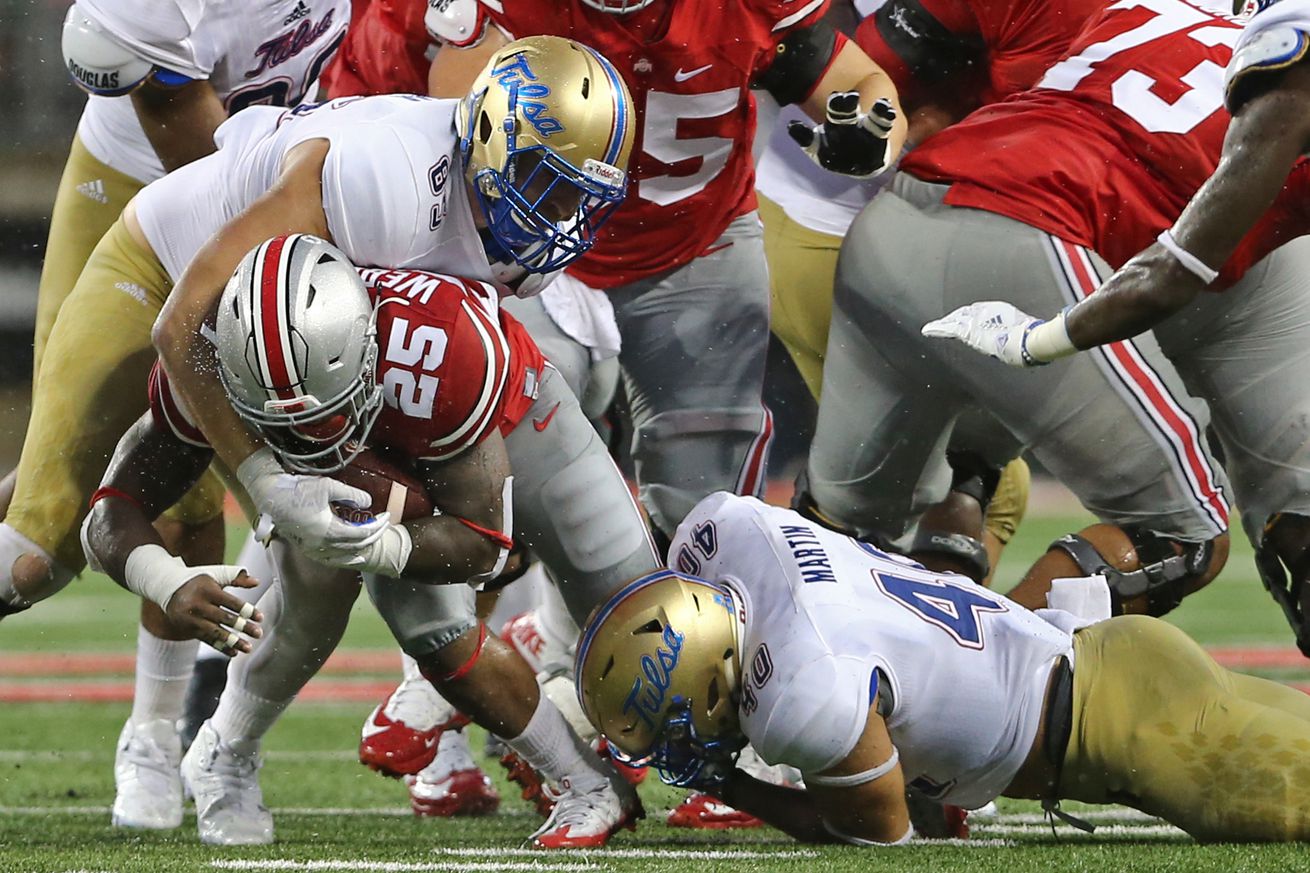
This is the big one we've been waiting for. The Buckeyes have looked incredible through two games, beating Oklahoma warm-ups Bowling Green and Tulsa by a combined 125-13 margin. But Oklahoma has far more talent on both sides of the ball than either team and will be Ohio State's biggest test until Michigan State this season. The Sooners may have lost to Houston in week one, but that did nothing to diminish their chances against the Buckeyes this week.
Avg Team Talent Turnover Margin Net Explosiveness (10+) Net Explosiveness (20+) Off IsoPPP
Ohio State 91.42 (2) +7 23 11 1.2 (84)
Oklahoma 87.73 (18) -1 -1 4 1.3 (53)
Starting this week, and assuming it's actually useful, I thought I'd start noting three basic statistics: team talent, turnover margin, and net explosiveness.
Average team talent is from the 247 Composite average team talent rating and is esentially how talented the average player is on each team. So this season, the average player on Ohio State's roster has a 91.42 247 Composite rating. I ran a regression between 2015 average team talent and F/+, and average team talent explained roughly 41% of the variance in final F/+ rankings.
The other metrics -- turnover margin and explosiveness -- come from one of Tom Herman's analyses of his teams' victories (going back to his OSU days too): If a team wins the turnover battle and has more explosive plays than the other team then they win 98% of the time. So I just use basic, non-opponent adjusted data here to roughly capture those ideas.
I added the 10+ and 20+ net explosiveness metrics because IsoPPP measures how explosive successful plays are, meaning that a team (like Ohio State so far this season) can have a ton of small explosive plays (between 10-19 yards) but they don't have very many big explosive plays (20+ yard breakaway runs or long bombs). The numbers in parentheses are the rankings.
So what can we get out of this brief, top-level comparison?
S&P+ Rush success rate Rush IsoPPP Pass success rate Pass IsoPPP Avg FP Finishing Drives
Ohio State 14 3 97 59 23 40 2
Oklahoma 61 3 120 99 71 67 76
When Oklahoma has the ball
S&P+ Rush success rate RushIsoPPP Pass success rate Pass IsoPPP Avg FP Finishing Drives
Ohio State 19 30 29 28 15 17 4
Oklahoma 1 17 40 13 80 76 39
If Oklahoma maintains a high level of offensive efficiency and Ohio State's defense isn't able to create negative plays or turnovers, then this could easily turn in to a shootout. The best chance Oklahoma has to win is by shutting down the run game, for J.T. Barrett to turn in an off day and throw a few interceptions, and for the defense to both not get pressure or force turnovers.
Also, as you'll see below, the metrics really don't like Ohio State in this game, with S&P+ giving Oklahoma a 61% win expectancy. Its important to note that the metrics are still (very) largely dependent on preseason projections -- and Ohio State has beaten the projections in both games this season. That same caveat applies to all of the metrics above, too -- there's just not a ton of data yet.
The 4 most important stats
F/+: Oklahoma by 7.6
S&P+: Oklahoma 38, Ohio State 33 (61% probability)
My Pick: Ohio State 41, Oklahoma 31
Continue reading...
Chad Peltier via our friends at Land-Grant Holy Land
Visit their fantastic blog and read the full article (and so much more) here
The Buckeyes will need big passes and a stout red zone defense to beat the Sooners.
This is the big one we've been waiting for. The Buckeyes have looked incredible through two games, beating Oklahoma warm-ups Bowling Green and Tulsa by a combined 125-13 margin. But Oklahoma has far more talent on both sides of the ball than either team and will be Ohio State's biggest test until Michigan State this season. The Sooners may have lost to Houston in week one, but that did nothing to diminish their chances against the Buckeyes this week.
Avg Team Talent Turnover Margin Net Explosiveness (10+) Net Explosiveness (20+) Off IsoPPP
Ohio State 91.42 (2) +7 23 11 1.2 (84)
Oklahoma 87.73 (18) -1 -1 4 1.3 (53)
Starting this week, and assuming it's actually useful, I thought I'd start noting three basic statistics: team talent, turnover margin, and net explosiveness.
Average team talent is from the 247 Composite average team talent rating and is esentially how talented the average player is on each team. So this season, the average player on Ohio State's roster has a 91.42 247 Composite rating. I ran a regression between 2015 average team talent and F/+, and average team talent explained roughly 41% of the variance in final F/+ rankings.
The other metrics -- turnover margin and explosiveness -- come from one of Tom Herman's analyses of his teams' victories (going back to his OSU days too): If a team wins the turnover battle and has more explosive plays than the other team then they win 98% of the time. So I just use basic, non-opponent adjusted data here to roughly capture those ideas.
I added the 10+ and 20+ net explosiveness metrics because IsoPPP measures how explosive successful plays are, meaning that a team (like Ohio State so far this season) can have a ton of small explosive plays (between 10-19 yards) but they don't have very many big explosive plays (20+ yard breakaway runs or long bombs). The numbers in parentheses are the rankings.
So what can we get out of this brief, top-level comparison?
- Both Ohio State and Oklahoma are among the top 20 most talented teams in the country. But there's a definite difference here. The average Ohio State player is rated nearly four points higher than the average Oklahoma player. This is actually a fairly large difference according to the normalized talent data -- Ohio State's average talent is an entire standard deviation above Oklahoma's (2.07 to 1.08).
- Oklahoma is -1 in turnover margin this year, largely due to not recording an interception yet (or throwing any, for that matter).
- Looking at explosiveness, Oklahoma has given up the 94th-most 10+ yard plays through two games, which is why their net explosiveness is -1 in that category too. Ohio State's offense doesn't look very explosive looking at 20+ yard plays (on the ground, especially), but they've been very explosive in the 10-19 yard range. If these trends continue then Ohio State should be well positioned to move the ball in 10+ yard chunks. The lack of 20+ yard plays accounts for Ohio State's poor IsoPPP ranking.
- Overall, the picture here is that Ohio State is more talented by a fairly wide margin, has been far more productive generating defensive turnovers than Oklahoma, and has a significant advantage in the short-explosive play range.
S&P+ Rush success rate Rush IsoPPP Pass success rate Pass IsoPPP Avg FP Finishing Drives
Ohio State 14 3 97 59 23 40 2
Oklahoma 61 3 120 99 71 67 76
- Oklahoma's key is simple: shut down the Ohio State run game and force J.T. to be efficient passing. Oklahoma held their first two opponents -- Houston and UL-Monroe -- to an average of 2.42 rushing yards per play. That's... not great, especially when Houston's run game is extremely similar to Ohio State's (though it's worth noting that Houston is 120th in rushing success rate even after playing Lamar last week). So maybe the most critical thing to watch early in the game is how efficient Mike Weber, J.T., and Curtis Samuel are running the ball. In tight games the Ohio State offensive staff has a tendency to get clamp down on play diversity, often reverting to heavy quarterback running. If Weber is inefficient and passing downs are increasingly in the 3-and-7+ range, then that's a definite problem for Ohio State. The key metrics here are: Weber/Samuel's rushing success rate, the team's overall rushing opportunity rate (% 5+ yard rushes), and the average distance on third downs.
- The most optimistic metrics for the Buckeyes' run game are opportunity rate, power success rate, and stuff rate, where the Buckeyes are ranked third, first, and first. Oklahoma's defense is 6th, 48th, and 12th. This means that the OSU offensive line consistently gets a great push, hardly ever allows negative plays, and wins third-and-short consistently (they haven't lost a third-and-short run yet this season). That OU's defense is ranked markedly lower on power success rate suggests that the Buckeye offensive line might eventually get a solid push against the Sooners front. If that happens, then it might not be until later in the game.
- Another interesting thing to follow will be the number of explosive runs the offense can generate. As we've said before, the Buckeyes excel in short explosive plays but hasn't hit many big runs yet. OU may be rated 120th in rushing IsoPPP, but they've still allowed just a total of 167 rushing yards this season, so even the few big runs they've allowed weren't that big. There's not too much data to suggest this is the game where the Ohio State run game will finally break the long touchdown run.
- Worse case scenario -- the Ohio State rushing success rate falls under 40% and the offense faces repeated third-and-longs -- the Buckeyes still might find some success. The Sooners have allowed a 45% passing success rate, which is just 99th in the country so far. Houston's Greg Ward Jr. and Lamar's quarterback were able to average 7.7 yards per attempt.
- Oklahoma doesn't generate a ton of pressure, ranked 61st in havoc rate and not recording a sack yet on standard downs. If the line has time, then it's fair to think there should be opportunities for big plays. Oklahoma has allowed 18 passes of 15+ yards so far and rank 99th in passing downs IsoPPP. This is surprising, because it means that Oklahoma allows big plays on passing downs even though they shut down the run and are extremely efficient on standard downs (11th!). Even in the worst case scenario above, then you could see big plays on passing downs despite fairly low efficiency on the ground and on standard downs. This isn't the way Ohio State wants to play though.
- Finally, one of the largest margins for Ohio State in the advanced stats is in finishing drives. The Buckeyes are second in finising drives (the bigger concern may really be avoiding three-and-outs) and Oklahoma is 76th, allowing an average of five points per opponent trip inside the 40.
When Oklahoma has the ball
S&P+ Rush success rate RushIsoPPP Pass success rate Pass IsoPPP Avg FP Finishing Drives
Ohio State 19 30 29 28 15 17 4
Oklahoma 1 17 40 13 80 76 39
- Something very strange happened in the Sooners' loss to Houston -- Samaje Perine and Joe Mixon, two of the best running backs in the country, had a combined 12 carries. That's astounding. It wasn't because they were ineffective, either -- they just didn't get the ball, similar to early last season. Expect that to change against Ohio State, as the Sooners are the 17th-most efficient running team in the country. The offensive line does a great job, producing five-yard runs on 46% of rushing attempts. They don't win every battle in short yardage situations, going 67% in third or fourth down and two yards or less, but in general they help lead an extremely efficient offense.
- That efficiency extends to the passing game as well, ranking 13th in success rate but just 80th in IsoPPP. Oklahoma's wide receivers fill two distinct roles. Dede Westbrook is the go-to option, easily leading the team in target percentage (25%) but with a relatively low average yards per catch (8.6). Sophomore Mark Andrews is the big-play option, averaging an insane 30.8 yards per catch, but getting just 8.8% of targets.
- The issue for Ohio State will be in containing all of Oklahoma's options, because any part of their offense has high efficiency potential. The Sooners can turn from Perine to Mixon to Westbrook and get a high degree of reliability. Throw in a target to Mark Andrews for the occasional explosive pass and the unknown factor of Baker Mayfield running the ball and it's clear why the Sooners are the top S&P+ offense in the country right now. That means that Ohio State's defense can't afford to let the run game get going. If the Sooners' rushing success rate gets above 45% then that's a big problem. Mayfield has only run 9 times for 17 yards so far this season, but he has immense scrambling ability even if he's been contained so far. Ohio State's defense, as good as its been this season, hasn't had to also deal with the threat of a mobile quarterback yet.
- So far those numbers are fairly challenging for the Buckeye defense, but there are some good signs. First, the defense should at least make the Sooners drive the length of the field due to poor average starting field position for the Sooners offense. Second, if they do drive the length of the field, they haven't been the best in the red zone, ranking just 39th. A few scoring opportunities that end in field goals instead of touchdowns could be the difference in the game. Finally, the offensive line allows a high percentage of negative plays -- nearly 19% of rushes are stuffed (68th) and they are 105th and 119th in standard and passing downs sack rates. The Buckeyes defense has generated pressure, but didn't have too much success actually getting to the quarterback so far against Tulsa and Bowling Green.
If Oklahoma maintains a high level of offensive efficiency and Ohio State's defense isn't able to create negative plays or turnovers, then this could easily turn in to a shootout. The best chance Oklahoma has to win is by shutting down the run game, for J.T. Barrett to turn in an off day and throw a few interceptions, and for the defense to both not get pressure or force turnovers.
Also, as you'll see below, the metrics really don't like Ohio State in this game, with S&P+ giving Oklahoma a 61% win expectancy. Its important to note that the metrics are still (very) largely dependent on preseason projections -- and Ohio State has beaten the projections in both games this season. That same caveat applies to all of the metrics above, too -- there's just not a ton of data yet.
The 4 most important stats
- Finishing drives -- on both offense and defense
- Offensive rushing success rate
- Generating explosive passing plays
- The defense must generate either sacks or turnovers -- but at least one
F/+: Oklahoma by 7.6
S&P+: Oklahoma 38, Ohio State 33 (61% probability)
My Pick: Ohio State 41, Oklahoma 31
Continue reading...